- Demographic Reports
75+ Must-Know LGBTQ+ Workplace Discrimination Statistics [2026]: Rates and Trends
Research Summary. Despite legal protections against termination based on sexual orientation or gender identity, harassment and discrimination in the workplace continue to pose significant challenges for LGBTQ+ individuals. Our data analysis team has conducted extensive research and found the following:
-
46% of LGBTQ+ workers have experienced unfair treatment at work at some point in their careers.
-
More than 33% of LGBTQ+ Americans and over 60% of transgender Americans faced discrimination in 2020.
-
36% of LGBTQ+ individuals report harassment or discrimination at work, making it the second most common
-
10% of LGBTQ+ employees have resigned from a position due to an unsupportive work environment.
-
93% of Fortune 500 companies have non-discrimination policies that include sexual orientation, and 91% include gender identity.
-
20% of LGBTQ+ Americans have encountered discrimination based on sexual orientation or gender identity during the job application process.
-
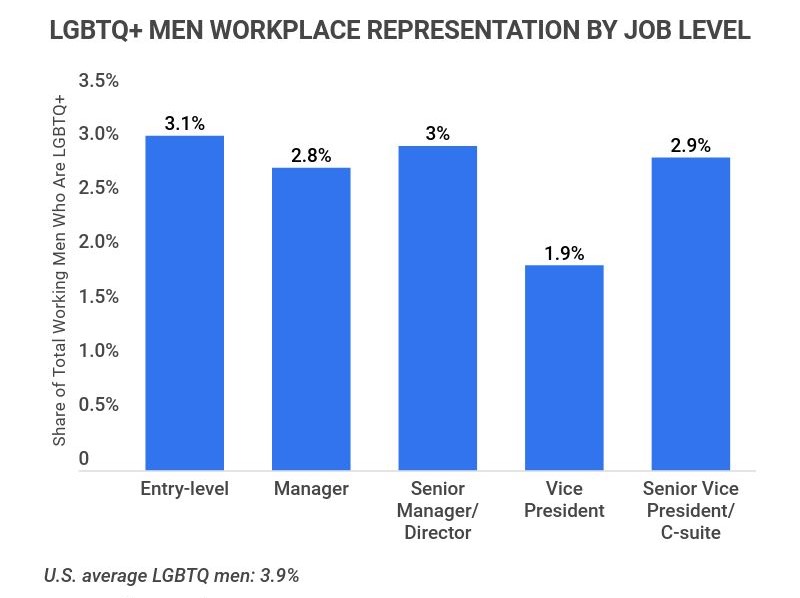
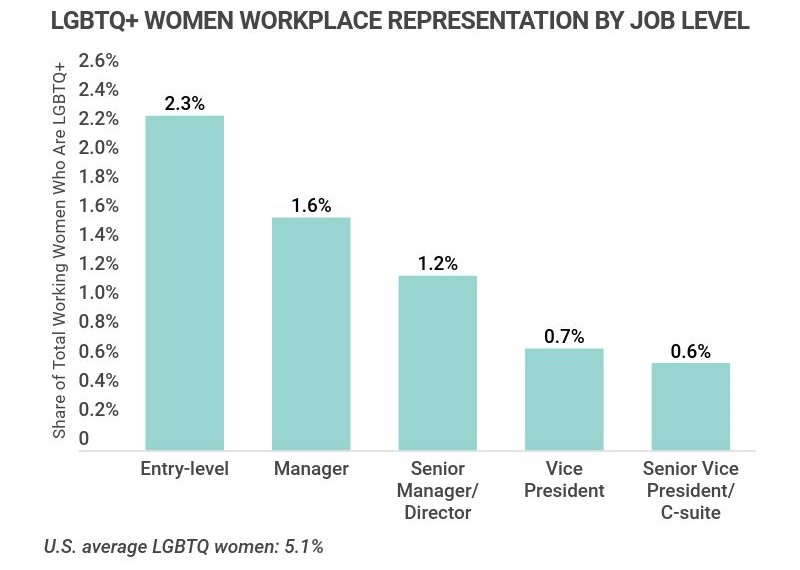
While 5.1% of American women and 3.9% of men identify as LGBTQ+, LGBTQ+ women occupy only 0.6% of senior VP/C-suite roles for women, and LGBTQ+ men hold just 2.9% of senior VP/C-suite positions for men.
For deeper insights, we have organized the data in the following categories:
Evaluation + Promotion | Industry | Being ‘Out’ at Work | Employment | Job Type | Workplace Inclusivity/Exclusivity | Income
General LGBTQ+ Workplace Discrimination Statistics
-
7% to 41% of gay and transgender workers have faced verbal or physical abuse or had their workplace vandalized.
-
12% to 30% of heterosexual workers have witnessed discrimination in the workplace based on sexual orientation.
-
25% of LGBTQ+ individuals report experiencing discrimination based on sexual orientation or gender identity within the last year.
-
90% of transgender workers report experiencing some form of harassment or mistreatment at work.
-
Research indicates that between 15% to 43% of gay individuals have experienced workplace discrimination and harassment.
-
A majority (53%) of LGBTQ+ employees have reported hearing jokes related to their identities at work: 37% heard bisexual jokes, and 41% heard transgender jokes in 2018.
-
Matched pairs of women — where one woman in the pair is transgender — experienced a net discrimination rate of 42% against transgender applicants.
-
Nearly two-thirds (59%) of non-LGBTQ+ employees believe discussing sexual orientation or gender identity in the workplace is “unprofessional.”
-
Employees report feeling exhausted from concealing their sexual orientation (17%) and gender identity (13%).
-
Compared to straight women and men, bisexual women and men are 13% and 28% more likely to have experienced microaggressions.
-
Over half of LGBTQ+ women report experiencing sexual harassment during their careers — 1.4x more than straight women and 1.9x more than LGBTQ+ men.
-
1 in 5 LGBTQ+ workers report being told or implied by coworkers to dress in a more feminine or masculine manner.
-
31% of LGBTQ+ workers express feelings of unhappiness or depression in the workplace.
-
The primary reason LGBTQ+ employees refrain from reporting negative comments about LGBTQ+ individuals to a supervisor or human resources is the belief that no action will be taken. Many also wish to preserve their relationships with coworkers.

LGBTQ+ Workplace Discrimination Statistics by Evaluation and Promotion
Even after the hiring process, LGBTQ+ individuals often face disparities in promotions and raises compared to their heterosexual peers. In some cases, they are dismissed due to their sexual orientation or gender identity.
-
8% to 17% of gay and transgender workers report being overlooked for a job or terminated due to their sexual orientation or gender identity.
-
1 in 5 LGBTQ+ individuals say they have experienced discrimination regarding pay or promotions due to their identity.
-
10% to 28% of LGBTQ+ individuals received negative performance evaluations or were passed over for promotions because they are gay or transgender.
-
27% of transgender workers reported being fired, not hired, or denied promotion between 2016-2017.
-
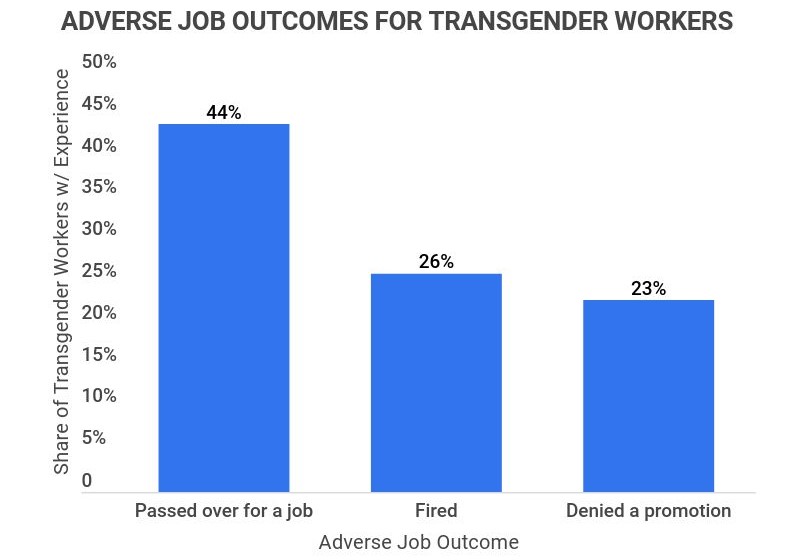
47% of transgender workers have encountered adverse job outcomes due to their identity. This includes:
-
44% were passed over for a job.
-
23% were denied a promotion.
-
26% were terminated due to their transgender status.
-
-
22% of LGBTQ+ Americans report not receiving equal pay or promotions compared to their counterparts.
-
LGBTQ+ individuals of color are more than 2x as likely as their white counterparts to report personal discrimination based on their LGBTQ+ identity during job applications and police interactions.
-
LGBTQ+ employees encounter both subtle and overt discrimination, even in environments perceived as inclusive.
-
LGBTQ+ women face heightened rates of sexual harassment and discrimination based on gender and sexual orientation.
-
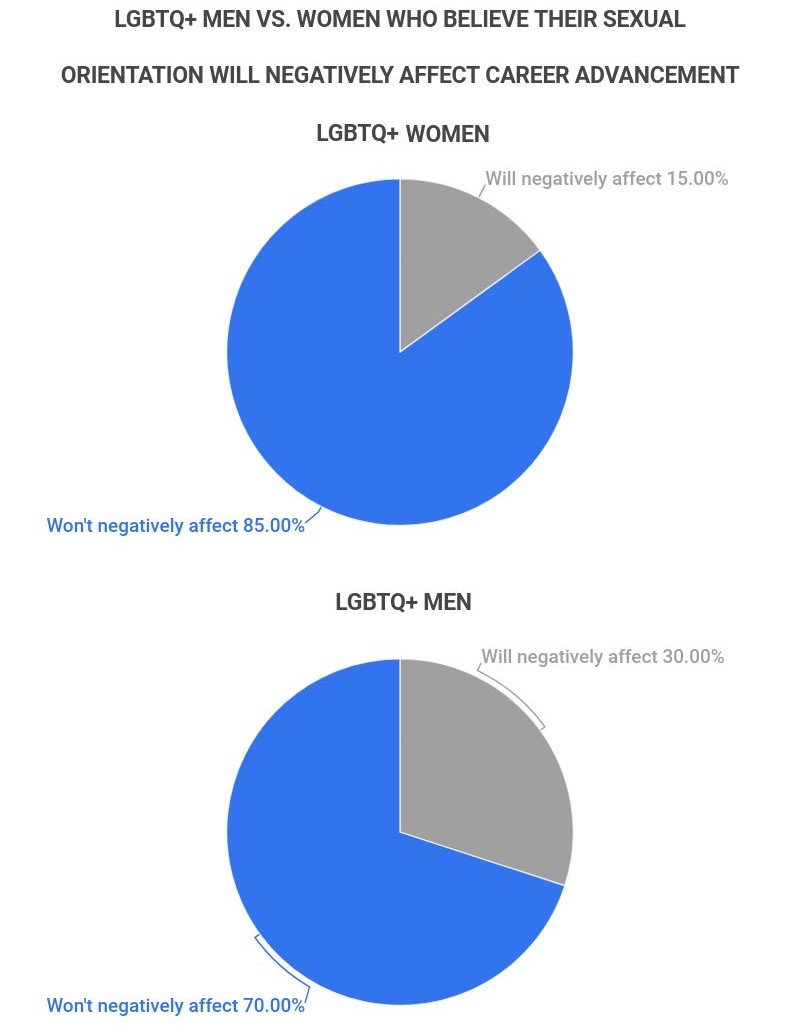
3 in 20 LGBTQ+ women believe their sexual orientation will adversely impact their career progression, while this perception is even more prevalent among LGBTQ+ men, at 6 in 20.
LGBTQ+ Workplace Discrimination Statistics by Industry
-
23% of restaurant workers report experiencing verbal abuse related to their sexual orientation.
-
In the tech industry, LGBTQ+ employees have reported significantly higher rates of bullying and public humiliation than their non-LGBTQ+ peers.
LGBTQ+ Workplace Discrimination During the Application Process Statistics
A substantial number of LGBTQ+ individuals have faced discrimination during job applications, leading many to conceal or not disclose their sexual orientation or gender identity.
-
20% of LGBTQ+ Americans have experienced discrimination related to their sexual orientation or gender identity while applying for jobs.
-
1 in 10 LGBTQ+ individuals report omitting items from their resume to hide their sexual orientation or gender identity from employers.
-
Research shows that gay men, queer women, and transgender applicants receive fewer callbacks compared to resumes that do not indicate their LGBTQ+ status.
LGBTQ+ Workplace Discrimination Statistics by Being ‘Out’ at Work
Many LGBTQ+ individuals choose not to disclose their sexual orientation at work, leading to the concealment of a significant aspect of their identity and uncomfortable situations.
-
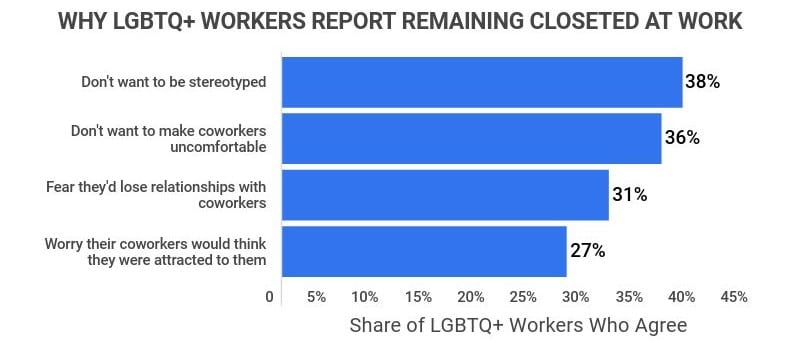
46% of LGBTQ+ workers report remaining closeted at work for various reasons, including:
-
38% fear of being stereotyped.
-
36% desire to avoid discomfort for coworkers.
-
31% worry that it would harm their relationships with colleagues.
-
27% fear coworkers may assume attraction to them.
-
-
54% of employees who are out at work still remain closeted with clients and customers.
-
26% of individuals who are closeted wish they could be open about their identity.
-
Fewer than 0.3% of Fortune 500 board directors were openly LGBTQ+ in 2020.
-
50% of non-LGBTQ+ employees report not having any openly LGBTQ+ coworkers at their workplace.
-
LGBTQ+ women are over 2x as likely as straight women to feel they cannot share personal aspects of their lives at work.
-
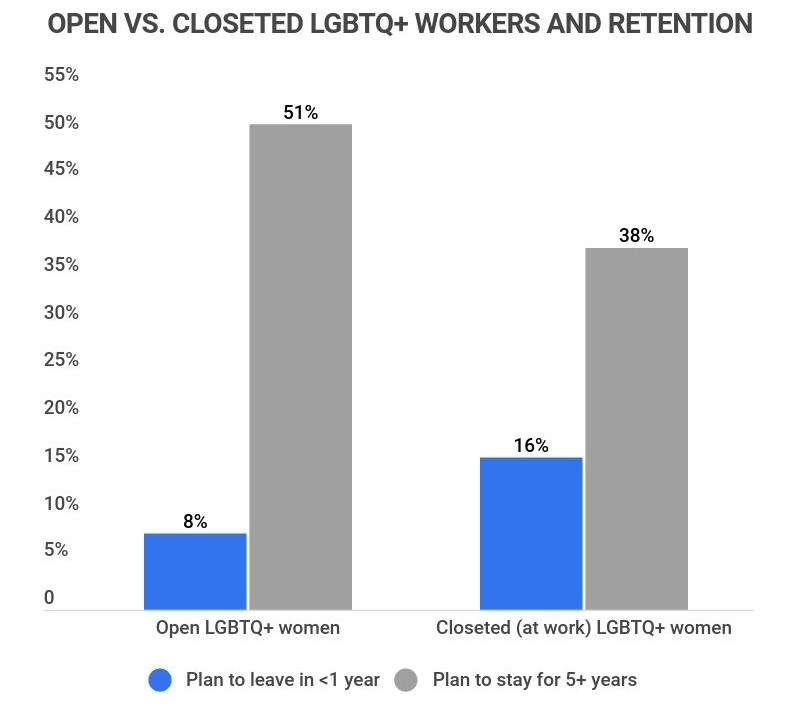
LGBTQ+ women who are open about their sexuality at work are half as likely (8%) to consider leaving their employer within the next year compared to their closeted counterparts (16%), and are a third more likely to plan to stay for five years or more (51% versus 38%).
-
36% of “out” employees have hidden aspects of their identity in the workplace over the past year.
-
Straight employees under 35 (Gen-Z and millennials) are 1.6 times more likely to know LGBTQ+ colleagues, and 3x more likely to value having LGBTQ+ colleagues who are out, compared to older non-LGBTQ+ employees.
LGBTQ+ Employment Statistics
Despite representing less than 5% of the population, LGBTQ+ individuals are significantly underrepresented in the corporate sector. Here are some general LGBTQ+ employment statistics:
-
In the United States, approximately 4.5% of the population — 11 million people — identify as LGBTQ+, with 88% participating in the workforce.
-
5.1% of U.S. women identify as LGBTQ+, as do 3.9% of U.S. men. However, their representation in corporate America is disproportionately low.
-
The LGBTQ+ workforce is increasingly diverse and includes more women, transgender employees, and individuals with varied sexual orientations, especially among younger generations.
-
Among LGBTQ+ employees under 35, 28% identify as women of color, compared to only 2% of those aged 55 and older.
LGBTQ+ Workplace Discrimination Statistics by Job Type
Over 20% of workers in the restaurant, food service, and healthcare industries identify as LGBTQ+. Furthermore, LGBTQ+ women are more likely to pursue senior leadership roles compared to straight or LGBTQ+ men.
-
2 million (15%) of LGBTQ+ workers are employed in restaurants and food services.
-
1 million (7.5%) of LGBTQ+ workers are in healthcare settings.
-
Approximately 40% of LGBTQ+ employees work in sectors where they face higher risks of infection and economic instability.
-
LGBTQ+ women are 1.5x more likely than straight men and 1.2x more likely than LGBTQ+ men to be motivated to advance into senior leadership roles to serve as role models for others.
-
Transgender individuals are less likely to hold management, evaluation, or hiring responsibilities compared to their cisgender colleagues.
-
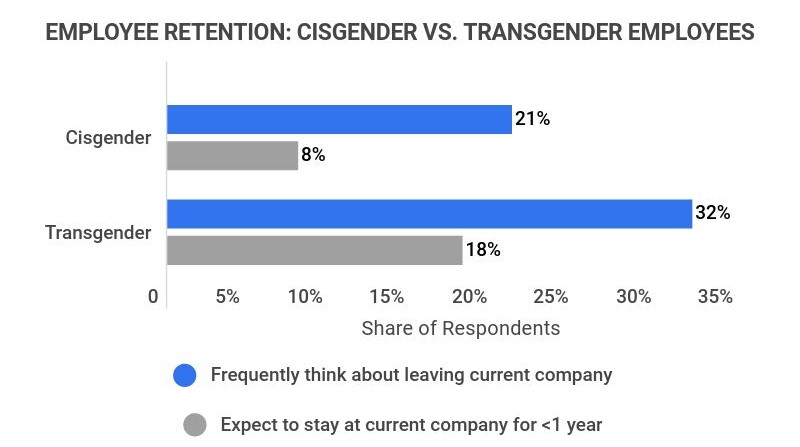
32% of transgender individuals frequently contemplate leaving their positions, in contrast to 21% of cisgender individuals.
-
18% of transgender individuals expect to remain at their current employer for less than a year, compared to 8% of their cisgender counterparts.
LGBTQ+ Employment Statistics by Workplace Inclusivity/Exclusivity
Though an LGBTQ+-inclusive workplace can significantly enhance business outcomes, LGBTQ+ individuals remain underrepresented in corporate America, with representation diminishing further in higher-level positions.
-
There is compelling evidence that an LGBTQ+-inclusive workplace positively impacts business performance, innovation, employee retention, and engagement.
-
25% of LGBTQ+ employees report staying in a job due to a supportive and inclusive work environment.
-
While LGBTQ+ women represent 2.3% of entry-level employees, they comprise only 1.6% of managerial roles and even fewer at senior levels.
-
LGBTQ+ women are nearly 2x as likely to feel compelled to engage in sexual discussions, humor, or actions compared to their straight and male LGBTQ+ counterparts.
-
LGBTQ+ women of color are 8x more likely than straight white men to report feelings of “onlyness” (i.e., feeling like the only person of their gender identity, sexual orientation, or race in a group setting).
-
75% of LGBTQ+ employees have reported experiencing negative workplace interactions related to their LGBTQ+ identity in the past year.
-
Only 1 out of 5 U.S. companies provide paid family leave for LGBTQ+ employees.
-
Only 58% of Fortune 500 companies offer benefits inclusive of transgender healthcare.
-
53% of Fortune 500 companies offer domestic partner benefits, while 65% provide transgender-inclusive health benefits.
-
91% of Fortune 500 companies have updated their non-discrimination policies to include protections based on gender identity.
LGBTQ+ Workplace Discrimination Statistics by Income
In general, LGBTQ+ individuals earn less than their heterosexual counterparts and experience higher rates of unemployment, poverty, and homelessness.
-
Despite making up 4.5% of the adult population, LGBTQ+ adults account for 6.2% of those earning under $36,000 annually.
-
22% of LGBTQ+ workers do not receive equal pay or promotions compared to their colleagues.
-
Gay men earn 10% to 32% less than similarly qualified heterosexual males.
-
While gay men report higher earnings than lesbian women, both groups earn less than their non-LGBTQ+ counterparts.
-
Older LGBTQ+ adults experience higher poverty rates compared to their heterosexual peers.
-
Transgender individuals are 2x as likely to be unemployed and face four times the risk of living in poverty. Nearly 20% have experienced or are currently experiencing homelessness.
LGBTQ+ Workplace Discrimination FAQ
-
Can an employer ask if you are LGBTQ+?
Yes, your employer can inquire about your LGBTQ+ status, but they cannot legally compel you to respond. Regardless of whether you choose to disclose your gender or sexual orientation, protections under Title VII of the Civil Rights Act remain in place, prohibiting discrimination based on sex.
-
Why do companies ask if you are LGBTQ+?
Most companies inquire about your LGBTQ+ status to ensure equitable treatment. Understanding your identity can help them provide appropriate benefits such as family leave, transgender healthcare, and support for same-sex partners.
However, if you suspect that the inquiry is for discriminatory reasons, you have every right to refrain from answering.
-
Should I put LGBTQ+ on my resume?
Deciding whether to include your LGBTQ+ status on your resume is a personal choice. If you seek an employer committed to fair treatment and relevant benefits, stating your LGBTQ+ identity may be beneficial.
However, if you are uncomfortable disclosing this information to a potential employer, you are under no legal obligation to do so.
-
LGBTQ+map.com. LGBTQ+ People in the Workplace: Demographics, Experiences, and Pathways to Equity. Accessed 4/22/21.
-
Center for American Progress. The State of the LGBTQ+ Community in the Labor Market. Accessed 4/22/21.
-
Center for American Progress. Gay and Transgender People Face High Rates of Workplace Discrimination and Harassment. Accessed 4/23/21.
-
National Center for Transgender Equality and the National Gay and Lesbian Task Force. Injustice at Every Turn: A Report of the National Transgender Discrimination Survey. Accessed 4/23/21.
-
Center for American Progress. LGBT Older Adults: Falling Through the Safety Net. Accessed 4/23/21.
-
Catalyst. Lesbian, Gay, Bisexual, and Transgender Workplace Issues: Quick Take. Accessed 4/23/21.
-
Catalyst. Making Change: LGBT Inclusion—Implementing Policies, Programs, and Practices. Accessed 4/23/21.
-
BestCompaniesAZ. 2020 LGBT Discrimination Statistics in the Workplace. Accessed 4/23/21.
-
McKinsey & Company. How the LGBTQ+ Community Fares in the Workplace. Accessed 4/23/21.
-
Boston Consulting Group. A New LGBTQ+ Workforce Has Arrived—Inclusive Cultures Must Follow. Accessed 4/23/21.
-
Human Rights Campaign. Startling Data Reveals Half of LGBTQ+ Employees in the U.S. Remain Closeted at Work. Accessed 4/23/21.
References
- Demographic Reports
Author
Chris Kolmar is a co-founder of Zippia and the editor-in-chief of the Zippia career advice blog. He has hired over 50 people in his career, been hired five times, and wants to help you land your next job. His research has been featured on the New York Times, Thrillist, VOX, The Atlantic, and a host of local news. More recently, he's been quoted on USA Today, BusinessInsider, and CNBC.