Manufacturing Research Summary. The manufacturing sector in the US continues to be a foundational component of the national economy, showcasing resilience amid evolving challenges. For job seekers and employers alike, staying informed about the latest trends and data in the manufacturing industry is essential. Here are some key insights from our updated research:
-
Manufacturing contributed $2.5 trillion to the US GDP in 2023.
-
Manufacturing accounts for 11.5% of the US GDP.
-
As of 2026, 13.2 million Americans are employed in manufacturing.
-
Revitalizing key manufacturing sectors could create 1.7 million new manufacturing jobs.
For a deeper dive into the data, explore the following sections:
Production | Over Time | Downtime | Industry | Global

Manufacturing Employment Statistics
Despite misconceptions about the decline of manufacturing, this sector still employs millions of Americans nationwide. Here are the latest employment facts:
-
Manufacturing employs 9.8% of all US workers.
The proportion of Americans working in manufacturing peaked at 22% in 1979 and has seen a gradual decline since then.
-
The number of manufacturing jobs in the US is now only 1.5% lower than the pre-pandemic peak.
Since 2020, manufacturing jobs have steadily increased, adding 1.5 million new positions, although they have not yet returned to pre-pandemic levels.
-
The average manufacturing worker in the US now earns between $40,000 and $50,000.
Manufacturing jobs can vary by state, but the average manufacturing worker now makes approximately $20 an hour in 2026.
-
Manufacturing employment in the US has increased by 12.5% over the past 10 years.
In May 2013, about 11.7 million Americans were employed in manufacturing, with the current number rising to 13.2 million.
Manufacturing Employment Over Time
Year Manufacturing Employment 2026 13.2M 2025 13.0M 2024 12.5M 2023 12.984M 2022 12.789M 2021 12.259M 2020 11.646M 2019 12.815M 2018 12.657M 2017 12.409M 2016 12.334M 2015 12.333M 2014 12.146M 2013 12.000M -
The manufacturing industry remains the 4th largest employer in the US.
With 13.2 million people employed, manufacturing is surpassed only by Accommodation and Food Services (15.5 million), and Healthcare and Social Assistance (21 million).
Largest Employers in the US by Employment
Industry Number of Employees Healthcare and social assistance 21.0M Retail trade 16.0M Accommodation and food services 15.5M Manufacturing 13.2M Administrative and support and waste management and remediation services 12.9M Professional, scientific, and technical services 9.5M Construction 7.5M Finance and insurance 6.8M Wholesale trade 6.5M Other services 5.8M
Manufacturing Production Statistics
While US manufacturing production has not returned to its historical highs, there is a strong push towards reducing dependency on foreign manufacturing. Here are some relevant production statistics:
-
US manufacturing imports 19% of intermediate goods and services.
Current reliance on imports has increased from approximately 12% in the 1970s.
-
Approximately 1 in 9 manufacturing outputs are of foreign origin.
This reflects the ongoing need for imported intermediate goods and services.
-
US manufacturing output (in USD) increased by 85% from 1997 to 2023.
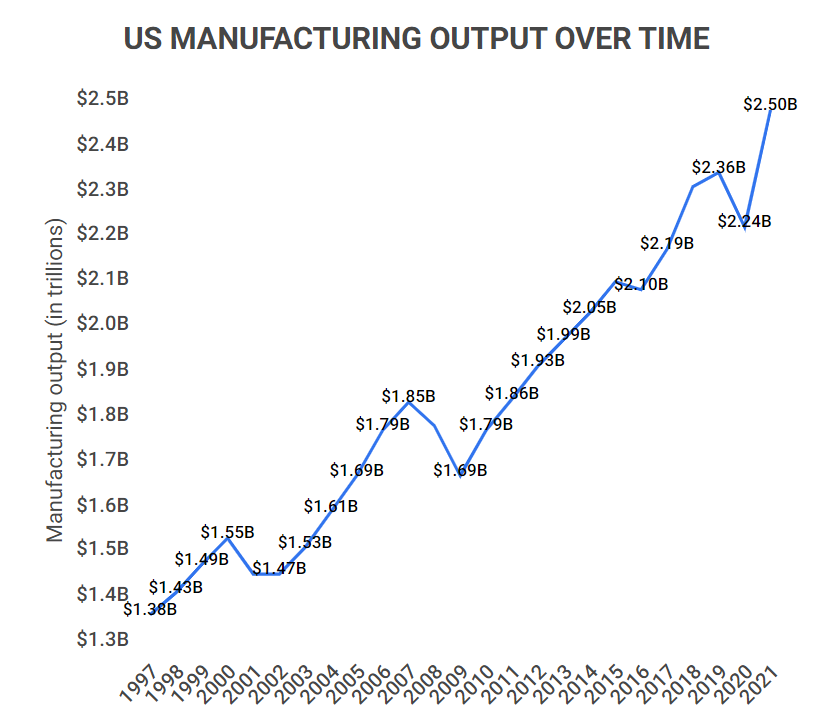
This increase does not account for inflation, as the manufacturing sector’s GDP share has decreased from 16.09% to around 10.5% during this period.
US Manufacturing Output Over Time
| Year | Output (in trillions) | Share of GDP |
|---|---|---|
| 2023 | $2.497T | 10.71% |
| 2022 | $2.238T | 10.63% |
| 2021 | $2.364T | 11.06% |
| 2020 | $2.092T | 10.63% |
| 2019 | $2.364T | 11.06% |
| 2018 | $2.330T | 11.35% |
| 2017 | $2.193T | 11.26% |
| 2016 | $2.098T | 11.22% |
| 2015 | $2.123T | 11.66% |
| 2014 | $2.046T | 11.66% |
| 2013 | $1.987T | 11.80% |
| 2012 | $1.927T | 11.86% |
| 2011 | $1.864T | 11.95% |
| 2010 | $1.792T | 11.91% |
| 2009 | $1.694T | 11.70% |
| 2008 | $1.804T | 12.22% |
| 2007 | $1.848T | 12.77% |
| 2006 | $1.795T | 12.99% |
| 2005 | $1.693T | 12.98% |
| 2004 | $1.609T | 13.17% |
| 2003 | $1.526T | 13.32% |
| 2002 | $1.470T | 13.45% |
| 2001 | $1.473T | 13.92% |
| 2000 | $1.549T | 15.12% |
| 1999 | $1.489T | 15.46% |
| 1998 | $1.429T | 15.77% |
| 1997 | $1.380T | 16.09% |
Manufacturing Production Over Time
The dynamics of manufacturing production have evolved due to various factors, including technological advancements and shifts in import reliance. Here are key trends that illustrate these changes:
-
US manufacturing production is down 0.5% year-over-year as of 2026.
Following a slight rebound, manufacturing production has shown a decrease as of mid-2026. Conversely, overall industrial production increased by 3.5% year-over-year.
-
The number of manufacturing firms and plants in the US has decreased by 25% since 1997.
This reduction has significantly affected production capabilities and overall output.
-
Manufacturing productivity has surged by 4.0% since 1987.
Although not all products are produced more efficiently, the manufacturing of motor vehicles has notably increased, with a 130% rise since 1987.
Manufacturing Downtime Statistics
Manufacturing downtime continues to pose challenges in the post-pandemic landscape. Here are some statistics reflecting the impact of downtime:
-
In the past three years, 85% of companies have experienced unplanned downtime.
Unplanned downtime can be costly; for instance, automotive manufacturers incur losses of approximately $25,000 per minute when a production line halts.
-
Manufacturing downtime costs companies an average of $300,000 per hour.
This expense can have a significant negative impact on profitability, despite the prevalence of downtime.
-
Manufacturers typically experience around 900 hours of downtime annually.
Causes of downtime often include maintenance, equipment failures, and operational adjustments, with human error and software/hardware issues being the most common culprits.
-
Companies lose an estimated $250 million due to downtime each year.
This figure highlights the staggering economic impact of downtime across the manufacturing sector.
Manufacturing Industry Statistics
The manufacturing industry significantly influences both the economy and the lives of consumers. Here are essential facts about this critical sector:
-
Producer prices for manufacturing have risen by 1.5% over the past year.
While inflation remains a concern, it fluctuates. For instance, prices decreased by 0.5% in May of 2026, but overall inflation rates are projected to rise.
-
US GDP could rise by 15% with restored growth and competitiveness in key manufacturing sectors.
Experts estimate that revitalizing manufacturing industries could generate over 1.7 million new jobs, boosting the economy significantly.
-
Manufacturing accounts for 22% of US capital investment.
Moreover, it contributes to 40% of productivity growth, 65% of exports, and 75% of R&D spending in the economy.
-
Every $1 invested in manufacturing produces $3.00 in economic activity.
This impressive return on investment underscores the importance of supporting the manufacturing sector for broader economic benefits.
Global Manufacturing Statistics
Manufacturing is a critical global industry, and here are some insights into its worldwide landscape:
-
The US ranks #2 in global manufacturing output.
Responsible for 18% of global manufacturing ($1.867 trillion), the US trails only China, which dominates with 20% of global output ($2.010 trillion).
Top 10 Countries by Manufacturing Output
Country Manufacturing Output (in billions) Share of Global Manufacturing China $2,010B 20% United States $1,867B 18% Japan $1,063B 10% Germany $700B 7% South Korea $372B 4% India $298B 3% France $274B 3% Italy $264B 3% United Kingdom $244B 2% Taiwan $185B 2%
US Manufacturing FAQ
-
How much of the US economy is manufacturing?
11.5% of the US economy (GDP) is manufacturing. In 2023, manufacturing businesses contributed $2.5 trillion to the GDP, with 13.2 million employees as of 2026.
-
Is US manufacturing growing?
US manufacturing has experienced fluctuations between growth and decline. For instance, after a net decline in 2021, the sector rebounded with a 0.26% growth in late 2022. However, certain sectors, such as aerospace, machinery, and electronics, have shown robust growth rates of 4% or higher.
-
When did US manufacturing start to decline?
US manufacturing began to decline after its peak in 1979. The most significant drop occurred between 2000 and 2010, resulting in the loss of nearly 6 million manufacturing jobs due to competition from cheaper foreign manufacturing.
Conclusion
The manufacturing sector remains a vital component of the US economy, employing approximately 13.2 million Americans and contributing 11.5% to the nation’s GDP as of 2026.
However, these statistics do not fully reflect the challenges faced by the manufacturing industry. Since its peak in 1979, the sector has seen significant declines.
Fortunately, targeted investments in manufacturing could potentially create 1.7 million new jobs and boost the US GDP by as much as 15%. It is imperative for policymakers and businesses to prioritize investments in domestic manufacturing to ensure future growth and sustainability.
References
-
McKinsey & Company – Delivering the US manufacturing renaissance
-
BLS – Forty years of falling manufacturing employment
-
Federal Reserve Bank – Labor Constraints Remain Greatest Challenge for Resurgent Manufacturing Sector
-
Macrotrends – U.S. Manufacturing Output 1997-2023
-
BLS – Productivity and compensation, 1987–2015
-
BLS – Producer Price Indexes
-
U.S. Department of Defense – U.S. Manufacturing Ecosystem Key to Economic Growth, Innovation, Competitiveness
-
Brookings – Global manufacturing scorecard: How the US compares to 18 other nations
Author
Jack Flynn is a writer for Zippia. In his professional career he’s written over 100 research papers, articles and blog posts. Some of his most popular published works include his writing about economic terms and research into job classifications. Jack received his BS from Hampshire College.