- Industry Statistics
- Wedding Industry Statistics
- Yoga Industry Statistics
- Music Industry Statistics
- Landscaping Industry Statistics
- Bicycle Industry Statistics
- Coffee Industry Statistics
- Car Rental Industry Statistics
- Home Improvement Industry Statistics
- Insurance Industry Statistics
- Supplements Industry Statistics
- Golf Industry Statistics
- Fitness Industry Statistics
- US Media And Entertainment Industry Statistics
- Firearm Industry Statistics
- Financial Services Industry Statistics
- Health And Wellness Industry Statistics
- Trucking Industry Statistics
- Wine Industry Statistics
- Pet Industry Statistics
- Mobile App Industry Statistics
- Digital Marketing Industry Statistics
- Hotel Industry Statistics
- Retail Statistics
- Robotics Industry Statistics
- Jewelry Industry Statistics
- Appointment Scheduling statistics
- Restaurant Industry Statistics
- Food Delivery Statistics
- Food Truck Industry
- Fashion Industry
- Real Estate Industry
- US Film Industry
- US Beverage Industry
- USu202fFast Food Restaurants
- US Construction Industry
- US Book Industry
- Cosmetics Industry
- US Food Retail Industry
- US Pharmaceutical Industry
- US Healthcare Industry
- Airline Industry
- Automobile Industry
- Transportation Industry Statistics
- Event Industry Statistics
- Project Management Statistics
- Oil And Gas Industry Statistics
- Nursing Home Statistics
- Nursing Shortage Statistics
- Nursing Statistics
40 Fascinating Mobile App Industry Statistics [2026]: The Success of Mobile Apps in the U.S.
Research Summary. From social media to productivity tools, mobile apps have become integral to daily life for millions of Americans. The growth of mobile applications has been remarkable since their inception, and our updated research highlights the continued expansion and significance of this sector:
-
There are over 5.9 million apps available on the Google Play Store and Apple App Store combined.
-
Over 2.4 million apps are available on the Apple App Store alone.
-
The average American has 85 apps installed on their smartphone.
-
Smartphone owners typically use 10-12 apps daily and around 35 per month.
-
87% of smartphone usage time is spent on apps.
-
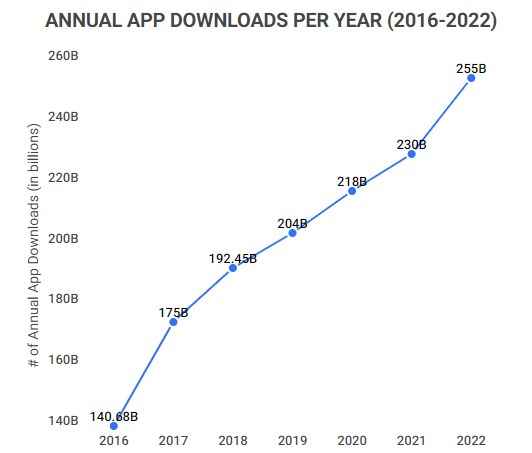
In 2022, 300 billion app downloads occurred globally, reflecting a robust trend.
-
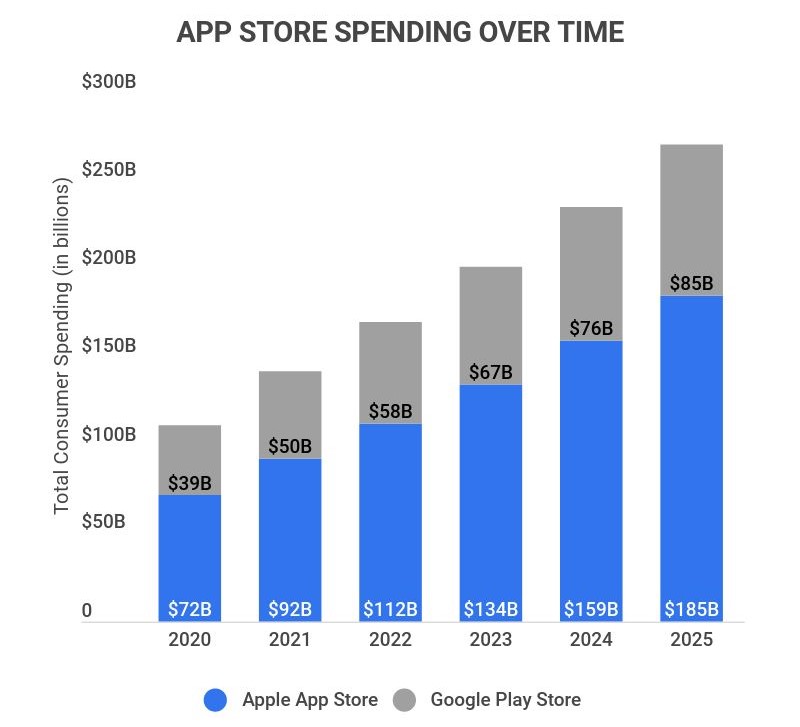
The Apple App Store and Google Play Store generated a combined $125 billion in revenue in 2023.
-
The annual number of app downloads has increased by 65% since 2016.
For further analysis, we broke down the data in the following ways:
App Users | Smartphone Users | Trends and Projections | User Retention | App Type | Popular Apps | Apple Store vs. Google Play Store
General Mobile App Industry Statistics
Mobile apps are deeply embedded in our lives, with usage continuing to escalate. Our updated findings indicate:
-
As of 2022, there were over 300 million apps downloaded daily.
This translates to approximately 110 billion apps downloaded annually, and projections suggest this could surge to 600 million daily downloads (over 200 billion annually) by 2026.
-
97% of Google Play’s revenue comes from free apps.
Free apps generate revenue through advertising and partnerships, effectively serving as marketing tools for brands.
-
Global consumer spending on apps reached $139 billion in 2023.
This reflects a steady increase from previous years, signaling strong consumer investment in mobile applications.
-
By 2026, consumer app spending is expected to reach $270 billion.
This indicates a significant upward trend in consumer investment in mobile applications.
-
By 2026, mobile apps are projected to generate approximately $1 trillion in revenue.
This growth is driven largely by advertising, alongside income from paid downloads and subscriptions.
Global App Revenue 2016-2023
| Year | Total App Revenue (in billions USD) | iOS App Revenue | Google Play App Revenue |
|---|---|---|---|
| 2023 | $139 | $90.95 | $48.05 |
| 2022 | $129 | $86.80 | $42.3 |
| 2021 | $133 | $85.10 | $47.90 |
| 2020 | $111 | $72.30 | $38.60 |
| 2019 | $89 | $58.40 | $30.60 |
| 2018 | $71.30 | $46.60 | $24.80 |
| 2017 | $58.10 | $38.50 | $21.20 |
| 2016 | $43.50 | $28.60 | $15 |
Mobile App Industry Statistics by App Users
Understanding user engagement is crucial for the mobile app industry. Our research reveals:
-
The average user engages with 35 apps monthly.
This means that around two-thirds or more of the apps installed on the average consumer’s phone are actively used.
-
53% of smartphone users check their apps 1-10 times daily.
A further 27% check their apps 11-20 times, while 15% check 21-50 times per day.
-
87% of smartphone usage time is spent on apps.
Specific apps dominate this time, with apps like Facebook accounting for a significant share of overall usage.

Mobile App Industry Statistics by Smartphone Users
Smartphones and mobile apps are interconnected. Here are the latest statistics:
-
As of 2023, there are approximately 6.9 billion smartphone users worldwide.
This represents about 87% of the global population, with expectations of reaching 7.9 billion by 2026.
-
The average American checks their phone approximately once every 8-10 minutes.
This translates to over 120 checks per day for the average American.
-
The average American spends about 5.3 hours on their phone daily.
About 25% of Americans spend more than 6 hours daily on their devices.
-
60% of smartphone users won’t download an app to complete a transaction.
Half of those who do download such apps uninstall them post-purchase.
-
Americans spend an average of 3 hours 30 minutes on mobile devices, slightly below the 3 hours 45 minutes spent on desktops.
Mobile App Industry Statistics by Trends and Projections
The mobile app landscape continues to evolve. Here are the key trends:
-
Mobile app revenue is anticipated to hit $201 billion by 2025.
This reflects a compound annual growth rate (CAGR) of 19.5%.
-
From 2021 to 2022, shopping app installs surged by 12% globally.
Usage rates for these apps have increased at an even higher rate of 35% year-over-year.
-
TikTok remained the most downloaded app in 2023, achieving over 120 million downloads in January alone.
-
From 2016 to 2021, yearly global app downloads rose by 65%.
-
Business app downloads increased by 102% in 2020, and continued growth is expected in the coming years.
Mobile App Industry Statistics by User Retention
Keeping users engaged is essential for app success. Here’s what our data shows:
-
51% of users uninstall an app if it consumes excessive memory.
-
70% of app users churn after three months.
-
59% of users uninstall apps after experiencing crashes or major errors.
-
26% of users abandon apps due to slow load times.
-
30-day retention is highest for eCommerce and retail apps at 42%.
-
90-day retention is highest for travel & lifestyle apps at 24%.
-
44% of apps require additional testing before launch.
-
58% of marketers utilize mobile apps for customer engagement.
Retention Rate by Type of App
| Type of Mobile App | 30 Day Retention Rate | 60 Day Retention Rate | 90 Day Retention Rate |
|---|---|---|---|
| Media & Entertainment | 39% | 28% | 23% |
| Ecommerce & Retail | 42% | 29% | 24% |
| Travel & Lifestyle | 38% | 29% | 24% |
| Business & Technology | 35% | 22% | 18% |
| Social Networking | 31% | 21% | 17% |
Mobile App Industry Statistics by App Type
The mobile app ecosystem is diverse. Here are some relevant statistics:
-
48% of app users primarily use apps for communication.
-
Gaming apps generated $89.6 billion in 2021, representing 67% of all app revenue.
-
79% of smartphone users have engaged in mobile purchases.
-
Over 800,000 educational apps are available.
-
Gaming apps dominate the Apple App Store, making up 21% of all available apps.
-
62% of smartphone users have gaming apps installed.
-
67% of smartphone owners rely on map apps, with Google Maps being the top choice for 78% of users.
Mobile App Industry Statistics by Popular Apps
Certain apps continue to stand out in the crowded market. Here are some key statistics:
-
Facebook remains the most downloaded app, surpassing 4 billion downloads by 2020.
-
In the U.S., TikTok was the most downloaded app in 2023, with 110 million downloads.
-
35% of 18-34-year-olds consider Amazon their most essential app.
-
98.5% of Facebook users access the platform via mobile devices.
The Top 10 Most Popular Apps in the U.S. (2023)
| App | Number of Downloads |
|---|---|
| TikTok | 110 million |
| 75 million | |
| Cash App | 66 million |
| 65 million | |
| Snapchat | 58 million |
| Subway Surfers | 53 million |
| Roblox | 51 million |
| Amazon | 49 million |
| Messenger | 48 million |
| 46 million |
Mobile App Industry Statistics by Apple Store vs. Google Play Store
Both app stores host a vast array of applications. Here’s how they compare:
-
As of 2023, there are 5.9 million apps across both the Apple App Store and Google Play Store.
-
The Google Play Store offers more free apps, with 97% being available at no cost.
Mobile App Industry Statistics FAQ
-
How big is the mobile app industry?
With over 5.9 million apps across the largest app stores, the mobile app industry is enormous. A staggering 300 billion app downloads occurred worldwide in 2022, reflecting ongoing growth.
Consumer spending on apps reached $139 billion in 2023, and projections suggest that mobile apps could generate around $1 trillion in revenue by 2026.
-
What percentage of companies have mobile apps?
36% of American retailers have at least one app. This number is even higher for small businesses, with 42% now having a mobile app.
-
How competitive is the mobile app industry?
The mobile app industry is highly competitive. Users expect high performance, including quick loading times and minimal errors, which raises the bar for all developers.
-
What percentage of apps are successful?
Only about 0.5% of apps achieve high success rates. The primary challenges include insufficient downloads and poor user retention, with 70% of users churning after three months.
-
What demographic uses apps the most?
Millennials aged 18-34 are the most active users of mobile apps, averaging 11 times per day.
-
What is the most popular mobile app?
Facebook is historically the most downloaded app of all time, with TikTok becoming the most downloaded in 2022.
-
What is the most profitable mobile app?
Netflix is the most profitable mobile app, generating substantial revenue each quarter.
Conclusion
The mobile app industry continues to thrive in the U.S. and globally. With over 5.9 million apps available across major platforms and significant revenue growth, the market remains vibrant and competitive. Despite challenges in user retention and the high volume of available apps, the ongoing demand for mobile applications indicates a bright future for this industry.
References
-
Statista. “Number of apps installed by mobile users in the United States as of 3rd quarter 2023.” Accessed on March 21st, 2023.
-
TechCrunch. “Consumers Spend 87% Of Time On Smartphones In Apps, But Only 5 Apps See Heavy Use.” Accessed on March 21st, 2023.
-
SensorTower. “Global Consumer Spending in Mobile Apps Reached $139 Billion in 2023.” Accessed on March 22nd, 2023.
-
SensorTower. “5-Year Market Forecast: App Spending Will Climb to $1 Trillion by 2026.” Accessed on March 22nd, 2023.
-
Statista. “Revenue of mobile apps worldwide 2017-2026, by segment.” Accessed on March 22nd, 2023.
-
BusinessofApps. “Most Popular Apps (2023).” Accessed on March 21st, 2023.
-
Statista. “Number of mobile app downloads worldwide from 2016 to 2023.” Accessed on March 21st, 2023.
- Industry Statistics
- Wedding Industry Statistics
- Yoga Industry Statistics
- Music Industry Statistics
- Landscaping Industry Statistics
- Bicycle Industry Statistics
- Coffee Industry Statistics
- Car Rental Industry Statistics
- Home Improvement Industry Statistics
- Insurance Industry Statistics
- Supplements Industry Statistics
- Golf Industry Statistics
- Fitness Industry Statistics
- US Media And Entertainment Industry Statistics
- Firearm Industry Statistics
- Financial Services Industry Statistics
- Health And Wellness Industry Statistics
- Trucking Industry Statistics
- Wine Industry Statistics
- Pet Industry Statistics
- Mobile App Industry Statistics
- Digital Marketing Industry Statistics
- Hotel Industry Statistics
- Retail Statistics
- Robotics Industry Statistics
- Jewelry Industry Statistics
- Appointment Scheduling statistics
- Restaurant Industry Statistics
- Food Delivery Statistics
- Food Truck Industry
- Fashion Industry
- Real Estate Industry
- US Film Industry
- US Beverage Industry
- USu202fFast Food Restaurants
- US Construction Industry
- US Book Industry
- Cosmetics Industry
- US Food Retail Industry
- US Pharmaceutical Industry
- US Healthcare Industry
- Airline Industry
- Automobile Industry
- Transportation Industry Statistics
- Event Industry Statistics
- Project Management Statistics
- Oil And Gas Industry Statistics
- Nursing Home Statistics
- Nursing Shortage Statistics
- Nursing Statistics
Author
Jack Flynn is a writer for Zippia. In his professional career he’s written over 100 research papers, articles and blog posts. Some of his most popular published works include his writing about economic terms and research into job classifications. Jack received his BS from Hampshire College.