Research Summary. As we look towards retirement, many of us envision a time to unwind and enjoy life. However, the path to achieving this dream is becoming increasingly complex, with the retirement age often seeming to stretch later into life.
Despite this trend, a significant portion of Americans have established retirement plans, though these plans can be influenced by various economic factors. Our comprehensive research reveals:
-
The average retirement age is 64.7 years for men and 62.1 years for women.
-
The average retirement account savings in the United States is $73,100 as of 2021.
-
69% of private industry workers had access to retirement plans through their employers as of March 2022.
-
25% of Americans have no retirement savings.
-
25% of Americans believe they need over $1 million to retire comfortably, while 38% think less than $250,000 is sufficient.
For further insights, we have categorized the data as follows:
Gender | Race/Ethnicity | Region | Trends | Plan Types
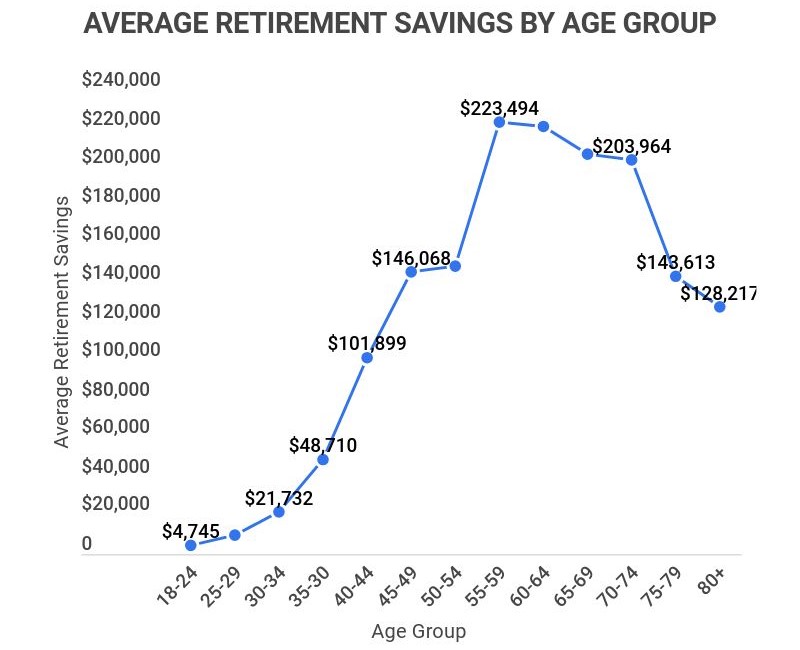
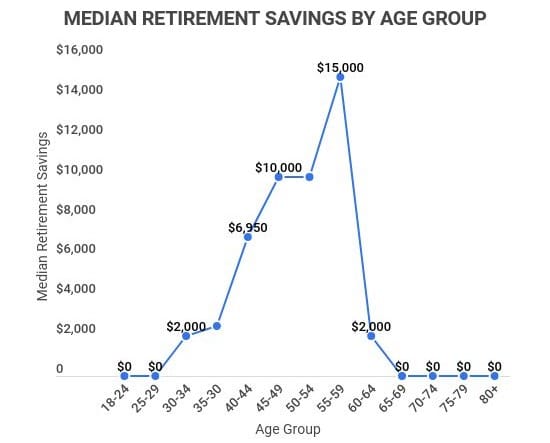
Average vs. Median Retirement Savings by Age
| Age | Average Retirement Savings | Median Retirement Savings |
|---|---|---|
| 18-24 | $4,745 | $0 |
| 25-29 | $9,409 | $0 |
| 30-34 | $21,732 | $2,000 |
| 35-39 | $48,710 | $2,500 |
| 40-44 | $101,899 | $6,950 |
| 45-49 | $146,068 | $10,000 |
| 50-54 | $148,950 | $10,000 |
| 55-59 | $223,494 | $15,000 |
| 60-64 | $221,452 | $2,000 |
| 65-69 | $206,819 | $0 |
| 70-74 | $203,964 | $0 |
| 75-79 | $143,613 | $0 |
| 80+ | $128,217 | $0 |
Note: This table reflects only those funds within designated retirement accounts (401(k), IRA, etc.). While the average retirement savings in the U.S. may seem robust, the median indicates that a substantial portion of the population holds less than $15,000 in retirement savings at their peak.

General Retirement Statistics
While many Americans believe they require millions to retire, the median retirement savings across the country stands at $73,100. This disparity can stem from insufficient savings habits or limited access to retirement plans through employment.
-
The median retirement savings for Americans with retirement accounts is $73,100.
Between 2021 and 2022, this figure increased by approximately 10%, from $65,900 to $73,100. However, this figure is not uniform across all age groups; for instance, retirement account savings average $51,000 for individuals aged 35-44 and $90,000 for those aged 45-54.
-
12% of retirees continue to work during retirement.
This group splits between full-time (5%) and part-time (7%) employment.
-
25% of Americans have no retirement savings.
This figure rises to 38% among those aged 18-29, correlating with the fact that one in three middle-class adults cannot cover a $400 emergency expense.
-
If you retire at 65, there is a 76% chance of enjoying ten years of retirement and a 38% chance of reaching twenty years.
Although the average life expectancy in the U.S. is 78.5 years, this number varies for individuals who reach 65 or 70. For instance, 76% of those retiring at 65 can expect at least ten years in retirement.
-
Since the onset of the COVID-19 pandemic, only 57% of seniors aged 60 or older possess at least $100,000 in retirement savings.
This represents a significant increase from the previous 26% pre-pandemic, indicating a growing number of seniors with less than $100,000 saved for retirement.
Retirement Statistics by Gender
When examining retirement, there are notable differences between men and women. Interestingly, women tend to retire earlier than men despite having longer life expectancies. Here are some key insights:
-
On average, women retire two years earlier than men.
The average retirement age for women is 62.1 years, while for men, it is 64.7 years.
-
Women have 40% less in retirement savings compared to men.
Despite retiring earlier, many women accumulate significantly less savings. Men average $98,000 in retirement savings, whereas women average only $62,000.
-
6% more men participate in 401(k) plans compared to women.
Overall, 61% of men participate in 401(k) plans, while only 55% of women do, contributing to the savings gap.
Retirement Statistics by Race and Ethnicity
Race and ethnicity also play a critical role in retirement savings and access. Unfortunately, non-white individuals face significant disadvantages in this area. Key findings include:
-
Approximately 30% more Black and Latino households lack retirement account assets.
62% of Black households and 69% of Latino households do not possess retirement account assets, compared to only 37% of White households.
-
Asian, Black, and Latino workers are less likely to have access to private-sector retirement plans.
Access rates are 13% lower for Asian, 15% lower for Black, and 42% lower for Latino workers compared to White counterparts.
-
Near-retiree households of color hold only one-fourth the retirement savings of White households.
While White near-retirees average around $120,000 saved, households of color average just $30,000.
-
Latino workers face significant challenges in retirement preparedness.
The statistics reveal that 32% more Latinos lack retirement account assets and are 42% less likely to have access to retirement plans.
Retirement Statistics by Region
The diverse geography of the United States results in varying retirement statistics across regions. States like Connecticut, New Hampshire, and New Jersey report average retirement savings exceeding $400,000, but this is not universal. Here are our findings:
-
Hawaii, South Dakota, and Massachusetts have the oldest median retirement ages at 66.
Compared to the national average of 62-64 years, these states add at least two additional years. Interestingly, the estimated savings needed for retirement varies widely; experts suggest $1,692,722 in Hawaii, while only $786,497 in South Dakota.
-
Connecticut boasts the highest average retirement savings at $523,568.
However, it also has a high annual cost for a comfortable retirement, averaging $70,817 annually.
-
Utah has the lowest average retirement savings at $300,568.
This is significantly higher than the national average but the lowest among actual retirees state by state, likely due to the state’s lower-than-average retirement costs of $54,363.
-
95% of retirees remain in their current state.
Despite discussions about relocating, the senior migration rate is only 5% post-recession.
-
Those who do migrate often move to Florida.
Many retirees from colder, higher-cost states like New York or Massachusetts relocate to warmer, more affordable states like Florida, where the cost of a comfortable retirement is $56,382 compared to $77,911 in New York.
Retirement Trends and Predictions
Understanding retirement trends requires a look at past, present, and future projections. While future trends can be unpredictable, here are some insights from experts:
-
New Mexico, Florida, Arizona, and South Carolina are the top retirement destinations.
These states have the highest number of retirees, with 43% moving to New Mexico, 39% to Florida, and 37% to Arizona and South Carolina.
-
Self-funded savings, including 401(k) accounts, constitute 79% of all retirement savings in the U.S.
This varies by generation; for instance, self-funded savings account for 87% of Baby Boomer savings, in contrast to 58% for millennials.
-
71% of Americans worry that Social Security will deplete during their lifetime.
Experts, however, argue the chances of this occurring are exceedingly low.
-
Currently, 55% of individuals plan to work during retirement.
Among this group, 35% do not have any retirement savings.
-
Americans now believe they need an average of $1.9 million to retire comfortably.
This figure has risen by 12% since 2019.
Types of Retirement Plans Statistics
Not all retirement plans offer equal benefits. As of now, 69% of private industry workers have access to retirement plans through their employment, indicating that a majority rely on their jobs for retirement planning. Here are more details:
-
69% of private industry workers have access to retirement plans through their employers.
This statistic heavily favors full-time employees over part-time workers; in 2020, 77% of full-time employees had access to retirement plans compared to just 39% of part-time workers.
-
40.2% of those over 60 rely solely on Social Security for their income.
Additionally, only 7.6% do not rely on Social Security at all, with their income primarily derived from defined benefits or contributions.
-
The average monthly Social Security retirement benefit is $1,507.53.
This amounts to approximately $18,000 annually, which is insufficient for many, given that 40.2% of seniors depend exclusively on this income.
-
91% of union workers have access to a retirement plan.
This is 24% higher than the national average and 26% higher than non-union workers.
Retirement FAQ
-
The answer varies based on factors like your location and anticipated Social Security benefits. As a rule of thumb, aim for your annual retirement income to be around 80% of your final pre-retirement salary.
For example, if your current salary is $60,000, you should aim for at least $48,000 annually in retirement income.
-
When should I claim Social Security?
You can claim benefits as early as 62, but waiting until your “full retirement age” increases your benefits. The maximum increase occurs around age 70.
For instance, claiming at 62 may result in a 30% reduction in monthly benefits, while delaying claims up to age 70 could yield an 8% annual increase.
-
How can I boost my retirement savings?
Starting to save now is the best way to enhance your retirement savings. For example, someone who begins saving $100 monthly at 35 will have around $150,000 by retirement, while a person starting at 25 with $75 monthly will accumulate over $250,000.
Other strategies include contributing to your 401(k), minimizing expenses, and setting financial goals.
-
How much does the average American have in savings when they retire?
The average American has $221,451.67 in retirement savings. This figure is based on average savings for those aged 60-64, which aligns with the average retirement age in the U.S.
However, this number may be skewed due to households with over $1 million in savings; the median retirement savings is only $73,100, with up to 25% of Americans having no retirement savings at all.
-
What percentage of Americans have $1 million or more in retirement savings?
Between 10-16% of American households have $1 million or more in retirement savings. If household net worth is considered, this percentage rises closer to 20%, but drops to 10% when focusing solely on retirement accounts.
-
Are most retirees millionaires?
No, most retirees are not millionaires. The average American has just over $220,000 in retirement savings, far from millionaire status. In fact, only 10-16% of Americans have at least $1 million saved for retirement.
Conclusion
The current retirement landscape in the United States is concerning, with many Americans estimating they need an average of $1.9 million in retirement savings to live comfortably. Yet, 40.2% of retirees survive on less than $20,000 per year.
Despite this, the average retiree spends only $48,106 annually. This disparity highlights a significant gap between perceived needs and actual savings statistics.
Furthermore, stark disparities exist in retirement savings between affluent white individuals and marginalized communities, with households of color averaging $90,000 less in retirement savings than their white counterparts.
Nevertheless, there are avenues for improvement. Unions, 401(k) plans, Social Security, and other resources can help bolster retirement savings. If you’re seeking to enhance your retirement preparation, consider engaging with your employer or exploring new job opportunities.
References
-
CRR. “How to Think About Recent Trends in the Average Retirement Age?” Accessed on February 1, 2023.
-
SmartAsset. “Average Retirement Savings: Are You Normal?” Accessed on June 27, 2022.
-
BLS. “How Do Retirement Plans for Private Industry and State and Local Government Workers Compare?” Accessed on February 1, 2023.
-
BLS. “67 Percent of Private Industry Workers Had Access to Retirement Plans in 2020.” Accessed on June 27, 2022.
-
Fox Business. “Here’s how much money Americans think they need to retire comfortably.” Accessed on June 27, 2022.
-
Board of Governors of the Federal Reserve System. “25% of US adults have no retirement savings.” Accessed on February 1, 2023.
-
Pew Research Center. “Working After Retirement: The Gap Between Expectations and Reality.” Accessed on June 27, 2022.
-
Forbes. “How Long Will Your Retirement Really Last?” Accessed on June 27, 2022.
-
Financial Advisor. “Women Have 40% Less In Retirement Savings Than Men, BofA Finds.” Accessed on June 27, 2022.
-
National Institute on Retirement Security. “Race and Retirement Insecurity in the United States.” Accessed on June 27, 2022.
-
GOBankingRates. “The Average Retirement Age in Every State.” Accessed on June 27, 2022.
-
CNBC. “Most retirees stay put — but those who move head here.” Accessed on June 27, 2022.
-
Investopedia. “The Most Popular States to Retire to in the U.S.” Accessed on June 27, 2022.
-
TransAmerica Center. “What Is “Retirement”? Three Generations Prepare for Older Age.” Accessed on June 27, 2022.
-
CNBC. “71% of Americans are worried Social Security will run out of money in their lifetimes. Why experts say that won’t happen.” Accessed on June 27, 2022.
-
CNBC. “Here’s where most Americans are really getting their retirement income.” Accessed on June 27, 2022.
-
Bankrate. “What is the Average Social Security Check?” Accessed on June 27, 2022.
-
Social Security Administration. “Fast Facts Figures About Social Security, 2020.” Accessed on June 27, 2022.
Author
Chris Kolmar is a co-founder of Zippia and the editor-in-chief of the Zippia career advice blog. He has hired over 50 people in his career, been hired five times, and wants to help you land your next job. His research has been featured on the New York Times, Thrillist, VOX, The Atlantic, and a host of local news. More recently, he's been quoted on USA Today, BusinessInsider, and CNBC.