As of 2026, there are approximately 70.4 million freelancers in the U.S. This represents around 36% of the U.S. workforce, with the total civilian labor force estimated at 164.3 million people.
Key Takeaways:
-
Between 2021 and 2022, the number of freelancers in the U.S. grew by over 20%.
-
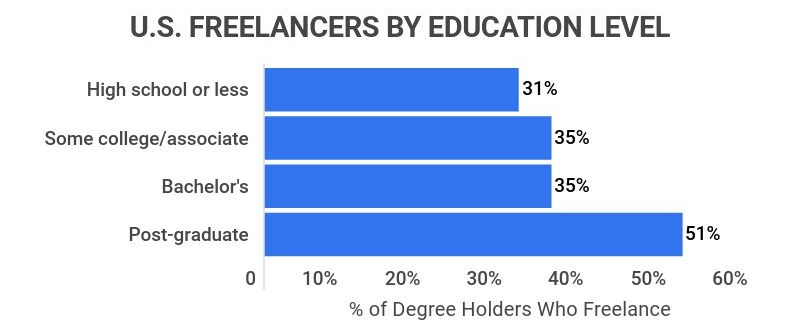
51% of workers with a post-graduate degree are engaged in freelancing, compared to only 31% of those with a high school diploma.
-
77% of workers in Art & Design pursue freelance opportunities, while only 19% of those in Office Work/Administrative Support do the same.
Freelancing Statistics
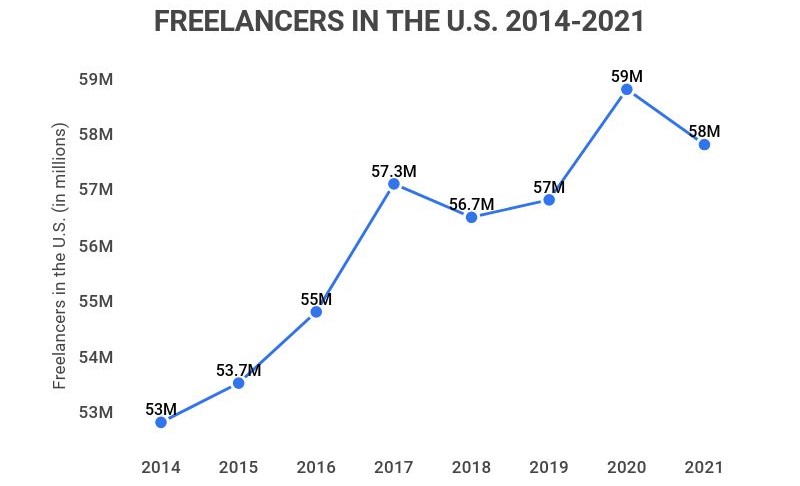
Since the pandemic, the freelance workforce has stabilized, having reached a peak in 2020 when approximately 59 million Americans were freelancing. While the pandemic accelerated this trend, the shift towards freelancing was already gaining momentum before 2020.
Number Of Freelancers As Share Of Labor Force
| Year | Civilian Labor Force (millions) | Freelancers (millions) | Share of Labor Force Freelancing |
|---|---|---|---|
| 2022 | 164.3 | 70.4 | 36% |
| 2021 | 161.2 | 58 | 36% |
| 2020 | 160.7 | 59 | 36.7% |
| 2019 | 163.5 | 57 | 34.9% |
| 2018 | 162.1 | 56.7 | 35% |
| 2017 | 160.3 | 57.3 | 35.7% |
| 2016 | 159.2 | 55 | 34.5% |
| 2015 | 157.1 | 53.7 | 34.2% |
| 2014 | 155.9 | 53 | 34% |
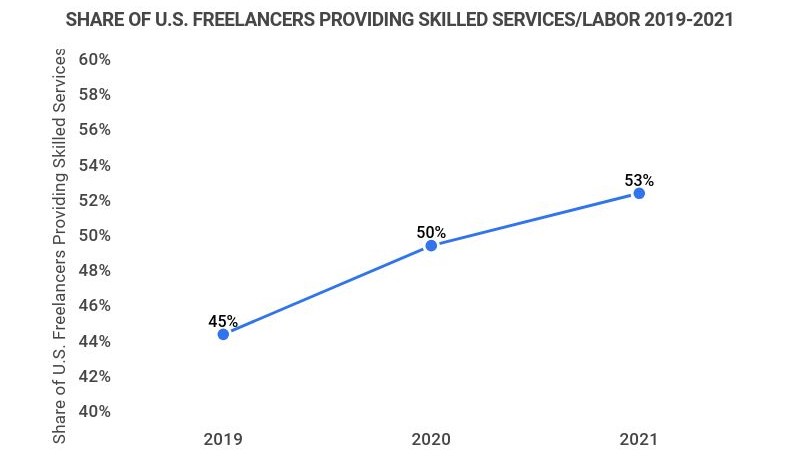
A notable trend from 2021 onward is the increase in skilled remote freelance work. By 2021, more than half of freelancers were providing skilled services, such as programming, marketing, business consulting, and writing.
Education Of Freelancers Statistics
The trend towards skilled freelance work is also reflected in the education levels of freelancers. More than half of individuals with post-graduate degrees are engaged in freelancing, compared to just 31% of individuals with a high school diploma or less.
Freelancing By Industry Statistics
Freelancers represent a diverse array of industries, with a particularly strong presence in Arts & Design, where 77% of workers engage in freelancing. In contrast, fields such as administrative support, manufacturing, and healthcare see significantly lower participation in freelance work.
Percent Of Freelancers By Industry
| Job Function | % of U.S. Workers Doing Freelance Work |
|---|---|
| Art & Design | 77% |
| Marketing | 58% |
| Computers/Mathematics | 53% |
| Construction | 52% |
| Personal Care/Wellness Service | 48% |
| Transportation | 39% |
| Finance/Business Operations | 37% |
| Sales | 33% |
| Education | 31% |
| Management | 29% |
| Healthcare Support | 28% |
| Food Prep/Service | 25% |
| Healthcare | 24% |
| Production/Manufacturing | 20% |
| Office Work/Administrative Support | 19% |
How Many Freelancers in the U.S. FAQ
-
How big is the freelance economy in the U.S.?
The freelance economy is valued at approximately $1.3 trillion in the U.S. This figure is derived from the total annual earnings of freelancers across the country, reflecting an increase of roughly $100 million since 2020, marking an 8.3% growth.
-
Are most freelancers temporary freelancers?
Yes, a majority of freelancers work on a temporary basis. As of 2021, about 65% of freelancers were temporary workers. Interestingly, temporary freelancers often report that they could earn more as traditional employees compared to their non-temporary counterparts who generally claim higher earnings from freelancing.
-
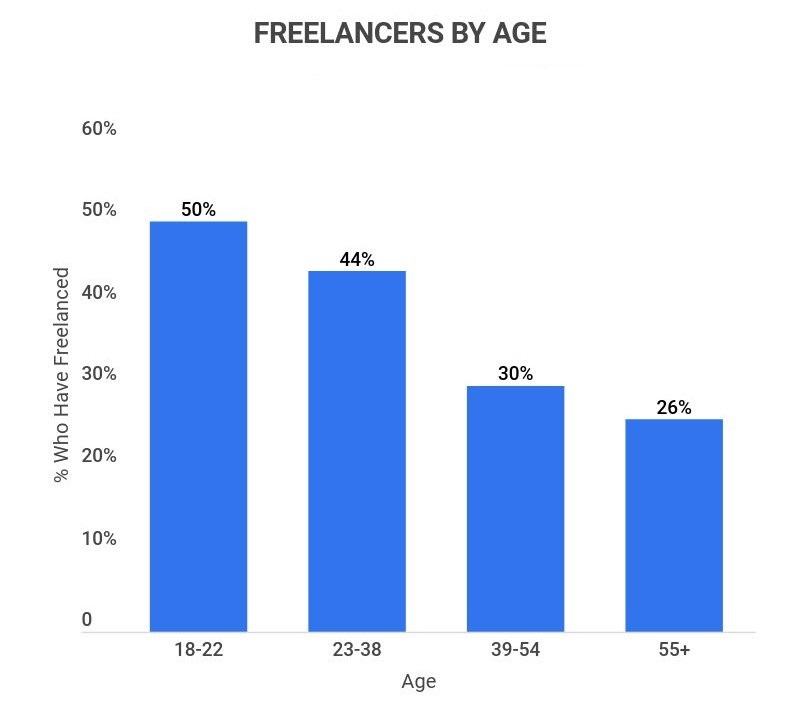
What generation freelances the most?
Gen Z freelancers lead the demographic. Around 50% of Gen Z individuals (ages 18-22) have engaged in freelance work. The participation rate decreases among older generations: 44% of Millennials, 30% of Gen X, and 26% of Baby Boomers have also participated in freelance work.
-
What percentage of freelancers are successful?
36% of freelancers achieve success, defined as earning over $75,000 annually. This success rate is notably higher compared to the approximately 15% of Americans who earn over $75,000 a year, indicating that freelancers, on average, tend to be more successful than traditional employees.
Additionally, 84% of full-time freelancers express satisfaction with their current roles, closely aligning with the 85% job satisfaction rate reported by the overall U.S. workforce.
Regardless of how one defines ‘success,’ freelancers appear to achieve it at equal or greater rates than their full-time, traditional counterparts.
References
-
U.S. Bureau of Labor Statistics. “Economic News Release, February 2026.” Accessed on March 2, 2026.
-
Upwork. “Freelance Forward Economist Report.” Accessed on March 2, 2026.
-
Zippia. “Freelancing Statistics.” Accessed on March 2, 2026.
Author
Matthew Zane is the lead editor of Zippia's How To Get A Job Guides. He is a teacher, writer, and world-traveler that wants to help people at every stage of the career life cycle. He completed his masters in American Literature from Trinity College Dublin and BA in English from the University of Connecticut.