- Business Statistics
- Startup Statistics
- Cloud Adoption Statistics
- Customer Loyalty Statistics
- Nonprofit Statistics
- Affiliate Marketing Statistics
- Cart Abandonment Rate Statistics
- Ridesharing Statistics
- Call Center Statistics
- eLearning statistics
- Customer Service Statistics
- Customer Experience statistics
- Entrepreneur Statistics
- Outsourcing Statistics
- Gross Revenue for Marketing and Advertising
- Sales Statistics
- MBA Statistics
- Average Small Business Revenue + Profit Margin
- How Much Do Employee Benefits Cost?
Ridesharing Industry Overview 2026. Ridesharing apps have transformed urban transportation, whether for daily commutes or leisure travel. From industry leaders like Uber to Lyft, these platforms have reshaped how we navigate our cities. Here are some key insights from our comprehensive analysis:
-
The global ridesharing market reached a valuation of $95.09 billion as of 2022.
-
36% of Americans have utilized a ridesharing app, more than double the percentage from 2015.
-
Uber commands a 71% market share in the U.S. rideshare sector, with Lyft capturing 29%.
-
The global ridesharing market is on track to expand, projected to reach $185.1 billion by 2026.
-
26% of ridesharing users engage with these services on a monthly basis.
For a deeper dive, explore our detailed sections:
Uber vs. Lyft | Uber Users and Drivers | User Statistics | Trends and Projections
General Ridesharing Industry Statistics
The ridesharing sector has transitioned from niche to mainstream transportation in just a few years. Here are the latest statistics reflecting its growth in the U.S. and globally:
-
In 2022, the rideshare industry generated $117 billion in revenue.
This figure is a remarkable 50% increase from 2020, underscoring the rapid expansion of ridesharing services. Continued growth is anticipated through 2026.
-
36% of Americans have accessed ridesharing services.
This is significantly higher than the 15% reported in 2015. Awareness of ridesharing has also surged; in 2015, 33% of the U.S. populace was unaware of these services, while by 2021, that figure had plummeted to just 3%.
-
Uber reported $31.8 billion in revenue for 2022.
This marks an impressive 82% increase from 2021, while Lyft achieved approximately $4.09 billion in revenue. Both companies have outperformed their 2020 figures.
-
Uber and Lyft account for 6% of total vehicle miles traveled (VMT) in the U.S.
Up from 1% in 2016, this represents more than a fivefold increase in just five years. In cities like San Francisco, this figure jumps to 13%.
-
China leads the world in rideshare usage, with 44% of its populace utilizing these services.
Following China are Russia at 42%, the United States at 36%, Brazil at 30%, and the United Kingdom at 11%.
Share of Ridesharing Users by Country
Country % of Population That Uses Ridesharing China 44% Russia 42% United States 36% Brazil 30% United Kingdom 11% -
The global ridesharing market is valued at $95.09 billion.
This represents significant growth from previous years, and projections indicate a continued rise, with the market expected to reach $185.1 billion by 2026.
Ridesharing Industry: Uber vs. Lyft
While Uber dominates the ridesharing market, Lyft remains a significant player. Our research reveals the following about these two giants:
-
Lyft has approximately 20.3 million monthly active users.
The average revenue per customer is $66, showing profitability despite fierce competition.
-
Uber boasts approximately 131 million monthly active users.
The average revenue per user is $72 as of January 2022, reflecting a 19% year-over-year growth. Uber continues to expand its user base.
-
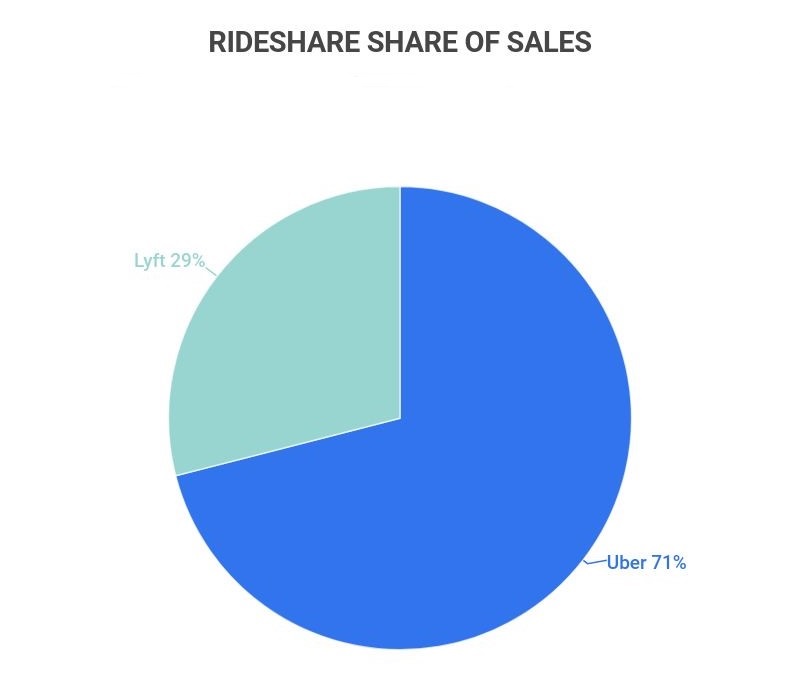
As of 2022, Uber holds a 71% share of U.S. rideshare sales, while Lyft has 29%.
Both companies reported significant sales growth from 2021, with Uber’s sales up 84% and Lyft’s up 62% year-over-year.
-
Uber’s average revenue per trip exceeds Lyft’s by 9%.
While Uber customers pay an average of $72 per ride, Lyft users average $66. Both companies have seen increases in these figures since 2021, with Uber’s up 19% and Lyft’s by 16%.
Ridesharing Industry by Uber Users and Drivers
As the leading rideshare service in the U.S., Uber plays a crucial role in transportation dynamics, especially in urban areas where it contributes to over 10% of VMT. Key findings include:
-
In 2022, Uber facilitated over 14 million rides daily.
This totals more than 5 billion rides per year, contributing to an estimated cumulative total of 10 billion completed rides. If trends persist, these numbers will continue to soar.
-
Uber’s revenue surged to $17.4 billion in 2021.
This marked a significant recovery from a dip in 2020, resulting in a 36% increase from $11.1 billion in 2020 and a 19% rise from $14.1 billion in 2019.
-
Uber operates in over 85 countries.
Popular markets include the United States, Australia, and various countries across Europe and Asia, with availability in over 10,000 cities globally.
-
Uber has approximately 1 million drivers in the U.S.
In California alone, this figure averages around 209,000 drivers quarterly. Globally, Uber estimates the number of drivers to be between 3-4 million.
-
The average Uber driver earns $364 monthly.
Many drivers work part-time, resulting in an average annual income of $36,525 for full-time drivers.
Ridesharing User Statistics
Ridesharing demographics reveal significant variances based on location and other factors. Here are some insightful statistics about ridesharing users:
-
Urban residents are over twice as likely to use ridesharing services compared to rural residents.
Among demographics with higher rideshare usage, such as college graduates and those earning over $75K annually, about 70% use these services, whereas only 32% of the same demographics in rural areas do.
-
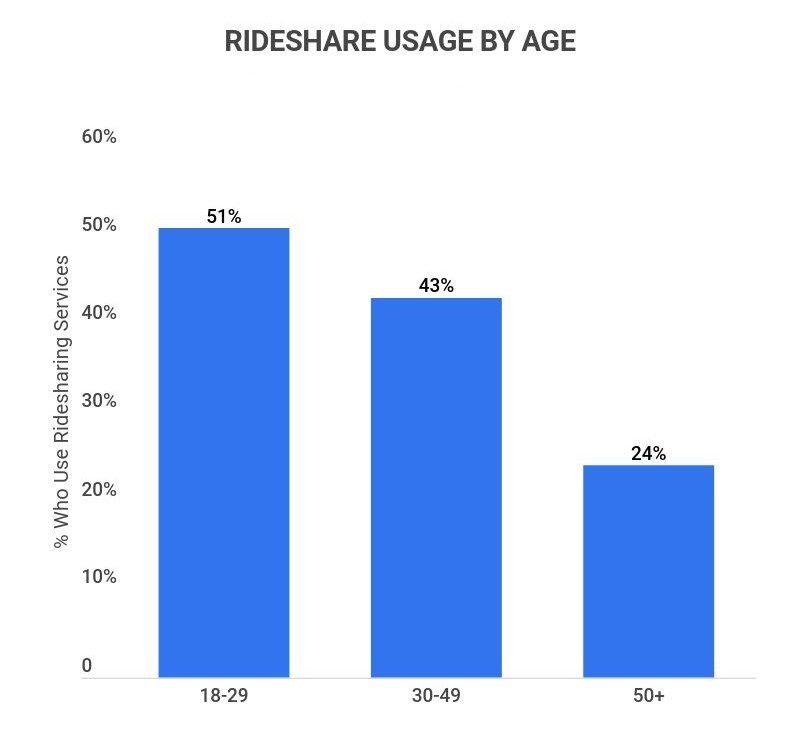
Individuals aged 18-29 exhibit the highest rideshare usage, with at least 51% using these apps.
Usage generally declines with age, with 43% of those aged 30-49 and only 24% of those over 50 having used a rideshare service.
-
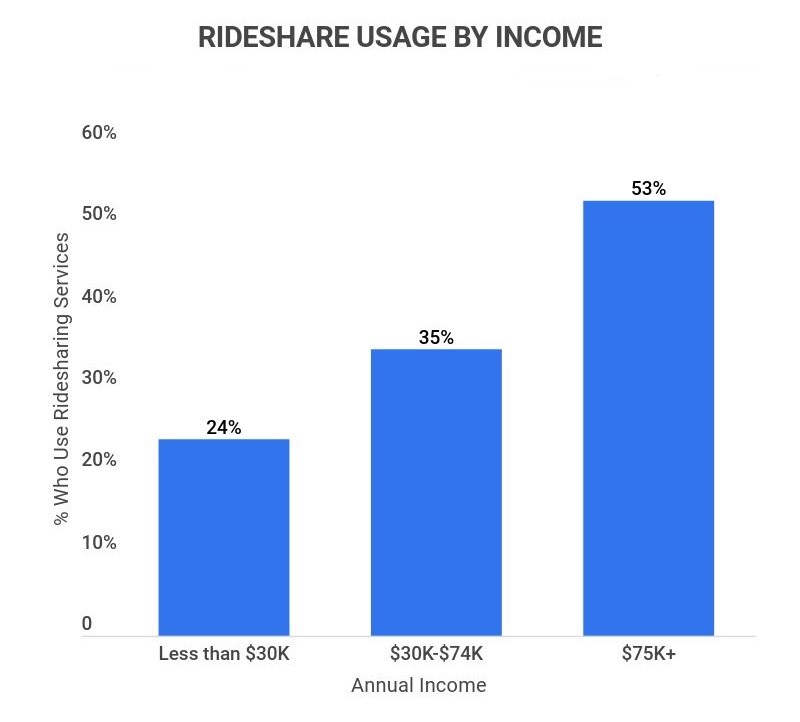
Users earning $75K or more are more likely to utilize ridesharing services, with 53% reporting usage.
This number decreases significantly among lower income brackets, with 35% of those earning between $30K-$74K and only 24% of those earning under $30K having used ridesharing services.
-
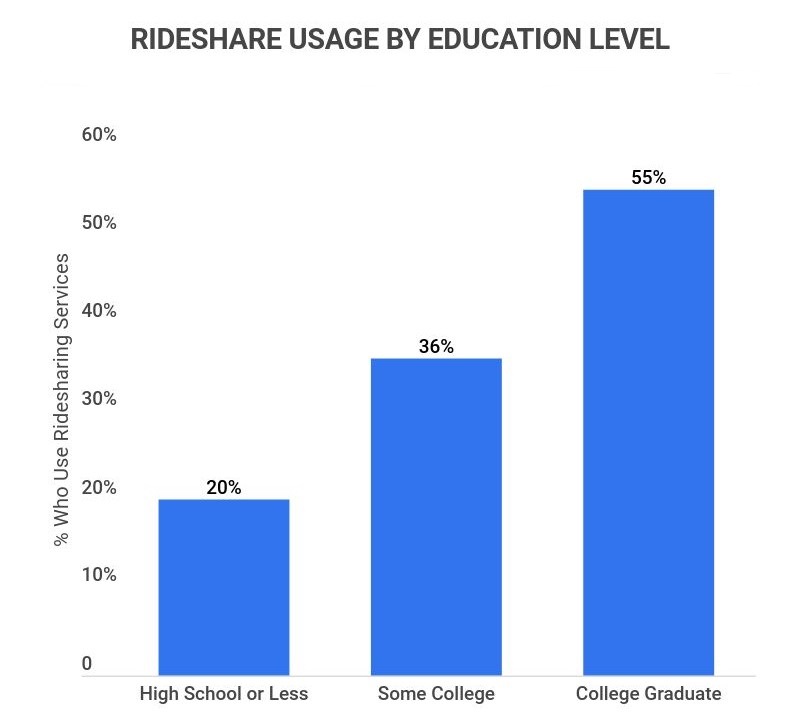
College graduates represent the highest usage rates among demographics, with 55% utilizing ridesharing services.
This is substantially higher than individuals with a high school diploma or less (20%) and those with some college education (36%).
-
70% of individuals who regularly walk or bike also use ridesharing services.
Conversely, only 31% within this demographic do not utilize ridesharing. Among personal vehicle owners, 64% have used a rideshare service, although 78% still prefer their own vehicles.
-
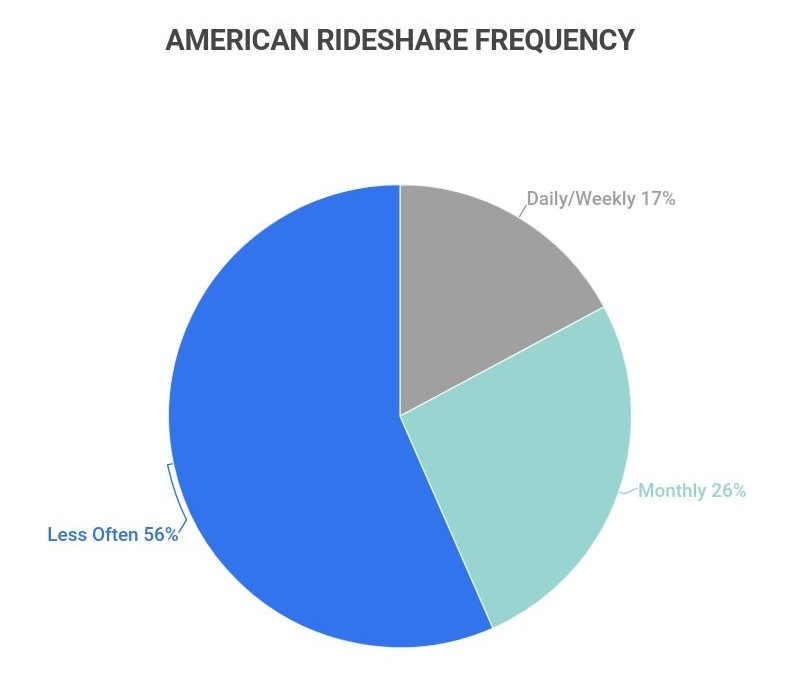
26% of ridesharing app users engage with ridesharing services on a monthly basis.
Additionally, 17% utilize these services daily, while a majority (56%) use them only occasionally.
Urban vs. Rural Ridesharing Demographics
| Demographic | % of Urban Population Using Ridesharing | % of Rural Population Using Ridesharing |
|---|---|---|
| Ages 18-29 | 55% | 36% |
| College Graduates | 70% | 32% |
| $75K+ Annual Income | 71% | 32% |
Rideshare Frequency and Transit Preferences
| Transit Preference | % Who Rideshare Daily/Weekly | % Who Rideshare Occasionally | % Who Never Rideshare |
|---|---|---|---|
| Drives car daily/weekly | 63% | 85% | 84% |
| Walks or rides bike daily/weekly | 70% | 41% | 31% |
| Takes taxi daily/weekly | 55% | 3% | 2% |
| Takes public transit daily/weekly | 56% | 19% | 9% |
Ridesharing Industry Trends and Projections
The ridesharing sector has witnessed remarkable growth over the past five years. Despite initial setbacks due to the global pandemic, recovery has been swift. Here are notable trends and projections for the ridesharing industry:
-
From 2017 to 2021, the rideshare market value increased twelvefold.
In 2017, the market was valued at only $6.68 billion, skyrocketing to $95.09 billion in 2022, indicating substantial growth.
-
The ridesharing industry is expected to maintain a CAGR of 16.6% from 2021 to 2026.
This growth trajectory represents a forecasted increase from $85.8 billion in 2021 to $185.1 billion by 2026.
Ridesharing Industry FAQ
-
How many rideshare drivers are there in the U.S.?
There are over 1.7 million rideshare drivers in the U.S., primarily from Uber and Lyft. Uber has approximately 1 million drivers, while Lyft has around 700,000.
Since its inception, Uber has seen a consistent increase in drivers, with the number doubling from 160,000 to 327,000 between 2014 and 2015. This number has continued to rise since.
-
How big is the ridesharing industry?
The ridesharing industry has rapidly expanded. As of 2022, the market value is $95.09 billion, representing a twelvefold increase from $6.68 billion in 2017.
Currently, 36% of Americans have utilized rideshare services, up from only 15% in 2015. Uber and Lyft together account for 6% of total vehicle miles traveled (VMT) across the U.S. Additionally, Uber has entered numerous international markets, operating in over 85 countries.
Overall, the ridesharing industry is projected to continue its upward trajectory, with expectations of reaching $185.1 billion by 2026.
-
What is Lyft’s market share?
Lyft holds a 29% market share in rideshare sales. While smaller compared to Uber, Lyft boasts around 18.6 million monthly active users, with an average revenue of $66 per customer, contributing significantly to its profitability.
-
Yes, Uber reported a profit in 2022. After not achieving profitability in 2021, the company experienced an 82% revenue spike that year, resulting in a 10% profit margin.
Uber’s previous losses in 2021 were attributed to significant investments, including those in the Chinese ride-hailing service Didi Global Inc., which contributed to a net loss of $2.4 billion.
-
What percentage do ridesharing companies take?
Ridesharing companies like Uber typically take an average of 24.7% per trip. For example, if a fare is $70, Uber retains over $17. This percentage is consistent across most rideshare companies, which generally take between 15-25% of the fare.
Conclusion
Since Uber’s launch in 2009, the ridesharing industry has experienced unprecedented growth. By 2015, only 66% of Americans were aware of ridesharing, and merely 15% had used these services. By 2021, awareness surged to 97%, with 36% actively utilizing ridesharing. This rapid evolution has positioned the industry at a valuation of $95.09 billion.
However, challenges remain. While ridesharing has gained traction in urban environments, particularly among younger and more educated populations, rural adoption lags, presenting hurdles such as driver shortages and the preference for personal vehicles.
Nonetheless, optimistic projections indicate that the ridesharing industry will continue its robust growth, with a forecasted CAGR of 16.6%, potentially reaching a market value exceeding $185 billion by 2026.
Sources
-
GlobeNewswire. “Global Ride Sharing Market Report 2021.” Accessed on February 20th, 2022.
-
Bloomberg Second Measure. “Uber vs. Lyft: Who’s tops in the battle of U.S. rideshare companies.” Accessed on February 20th, 2022.
-
Statista. “Ride-sharing market size worldwide in 2020 and 2021.” Accessed on February 21st, 2022.
-
Pew Research Center. “More Americans are using ride-hailing apps.” Accessed on February 21st, 2022.
-
Lyft. “Lyft Announces Solid Q4’21 and Fiscal 2021 Results.” Accessed on February 21st, 2022.
-
Wamu88.5. “Uber And Lyft Say They Make Up 7% Of Miles Traveled By Vehicles In D.C.” Accessed on February 21st, 2022.
-
Statista. “Country ranking with the highest share of ridesharing* users in 2018.” Accessed on February 21st, 2022.
-
Ride Share Guy. “How Many Uber Drivers Are There?” Accessed on February 21st, 2022.
-
Uber. “Use Uber in cities around the world.” Accessed on February 21st, 2022.
-
TheStreet. “How Much Do Uber and Lyft Drivers Make?” Accessed on February 21st, 2022.
-
Pew Research Center. “On-demand: Ride-hailing apps.” Accessed on February 22nd, 2022.
-
Grand View Research. “Ride Sharing Market Size(2019 – 2025).” Accessed on February 22nd, 2022.
- Business Statistics
- Startup Statistics
- Cloud Adoption Statistics
- Customer Loyalty Statistics
- Nonprofit Statistics
- Affiliate Marketing Statistics
- Cart Abandonment Rate Statistics
- Ridesharing Statistics
- Call Center Statistics
- eLearning statistics
- Customer Service Statistics
- Customer Experience statistics
- Entrepreneur Statistics
- Outsourcing Statistics
- Gross Revenue for Marketing and Advertising
- Sales Statistics
- MBA Statistics
- Average Small Business Revenue + Profit Margin
- How Much Do Employee Benefits Cost?
Author
Jack Flynn is a writer for Zippia. In his professional career he’s written over 100 research papers, articles and blog posts. Some of his most popular published works include his writing about economic terms and research into job classifications. Jack received his BS from Hampshire College.