Research Summary: We’ve been hearing about the fall of America’s middle class for decades now, but as it turns out, the combination of the COVID-19 Pandemic and inflation may have been the nail in the coffin.
To find out more about how the US middle class is struggling and shrinking, here are some crucial insights our research uncovered:
-
The middle class is any household that makes between $47,189 and $141,568 in 2023.
-
The median household income in the US is $70,784 per year.
-
72% of middle-income families say earnings are falling behind the rising cost of living.
-
Roughly 50% of the population is in the middle-class income bracket (compared to 61% in 1971).
-
74% of middle-class households say they are unable to save for the future.
For further analysis, we broke down the data in the following ways:
Demographics | Over Time | Middle Class

Middle-Class Demographics
Middle-class demographics have shifted and changed over time, with education becoming a barrier to entry, for example. In further detail, here are statistics that show what middle-class demographics are like in 2023:
-
52% of Americans consider themselves middle class.
It seems Americans have a fairly accurate understanding of what constitutes middle class, as 52% of people believe they’re middle class out of the roughly 50% who actually are.
-
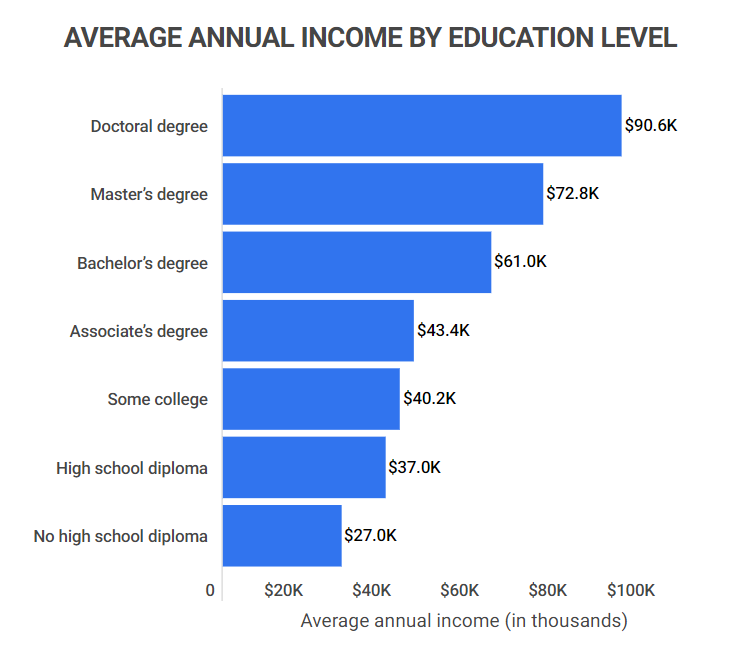
The average income of Americans who don’t graduate college (51.7% of citizens) is below the threshold of the middle class.
The average income for someone with a high school diploma in the US is $37,000 per year, which is around $10,000 less than what it would take to be considered middle class. On the other hand, Americans with a Bachelor’s degree make an average of $61,000 per year.
Average American Income By Education Level
Education level Average annual income Share of Americans with this income level Doctoral degree $90,600 2.0% Master’s degree $72,800 13.0% Bachelor’s degree $61,000 23.5% Associate’s degree $43,400 10.5% Some college, no degree $40,200 14.9% High school diploma $37,000 27.9% No high school diploma $27,000 8.9% -
White Americans are 10.6% more likely to be middle class than Black Americans.
As of 2023, 52% of White Americans can be considered middle class. On the other hand, 49% of Hispanic Americans and 47% of Black Americans, and Asian Americans are middle class.
Breakdown of Income Brackets By Race
Race Lower-Income Middle-Income Upper-Income White 31% 52% 25% Hispanic 40% 49% 10% Black 41% 47% 12% Asian 22% 47% 31% -
Those aged 18-29 are 15% more likely to be middle class than those 65+.
As wealth either grows or disappears over the course of someone’s lifetime, the middle class subsequently shrinks. 54% of people between 18-29 can be considered middle class, while 47% of those 65+ are.
Breakdown of Income Brackets By Age
Age Lower-Income Middle-Income Upper-Income 18 – 29 29% 54% 17% 30 – 44 27% 53% 21% 45 – 64 24% 49% 27% 65+ 37% 47% 16% -
94% of Millennials say inflation has impacted their home-purchasing plans.
Real estate prices have increased by an astronomical 45% between 2019-2023. That means that the average $250,000 home in 2019 is now worth over $360,000 today. Obviously, this has made it difficult for Millennials to purchase homes.
Middle-Class Over Time
The middle class has been shrinking over time as more and more Americans shift into the lower or upper-income brackets. To dive deeper into how exactly incomes have changed, here are some key statistics:
-
72% of middle-income families say earnings are falling behind the rising cost of living.
That’s a nearly 6% increase from last year when 68% of middle-class families in the US said the same.
-
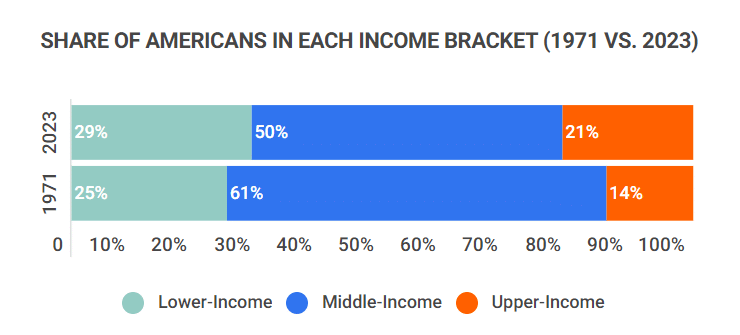
The share of Americans with a middle income has reduced by 18% since 1971.
61% of Americans were considered middle-income in 1971, compared to only 50% today. Both the lower and upper-income brackets have grown instead.
Change In US Income Brackets Over Time
Year Lower-Income Middle-Income Upper-Income 2023 29% 50% 21% 1971 25% 61% 14% -
In the last year, the average wealth of the middle 40% of Americans dropped by 7%.
Even more startlingly, there has been a net loss of around 40% since 2007, showcasing just how far the US middle class has fallen since the 2008 Recession.
Shrinking Middle Class
If it hasn’t already been made obvious, the evidence shows that the US middle class has been shrinking over time. Here are some interesting facts about just how bad things have gotten:
-
The Middle Class’ share of aggregate income decreased by 32% between 1971 and 2020.
In 1971, adults in the middle class accounted for 62% of aggregate income. However, as of 2020, that share fell to only 42% in 2020. Instead, the share among upper-income Americans has increased drastically from 29% to 50%.
Share of Aggregate Income By Bracket Over Time
Year Lower-Income Middle-Income Upper-Income 2023 8% 42% 50% 1971 10% 62% 29% -
59% of middle-income Americans say it’s unlikely today’s young adults will have a better life than their parents.
More than half of all middle-income Americans are concerned that younger generations will have a worse life than their parents. This is in stark contrast with previous generations, where the majority thought things would get better.
-
The US middle-class accounts for 16% less of the population when compared to other OECD countries.
The average size of the middle class across all other OECD countries is 61% of the population, which is on par with where the US was in the 1970s.
US Income Brackets Vs. Other OECD Countries (2016)
Country Lower-Income Middle-Income Upper-Income US 17% 51% 14% OECD 18% 61% 9%
Middle-Class FAQ
-
What caused the shrinking of the middle class?
There are a multitude of things that caused the shrinking of the middle class, from new technologies to globalization. In more detail, here are the top reasons why the middle class has gotten smaller:
-
New Technology. New technologies like the internet have fundamentally changed lives, and have also reduced the size of the middle class. Those who create new technologies have become much richer, while the jobs they produce tend to be low-income. This creates an imbalance not suited for growing the middle class.
-
Lack of Unions. In the past, unions held a lot of power in ensuring employees were compensated fairly. Today, however, the lack of unions means that jobs that once supported a middle-class lifestyle are no longer required.
-
Globalization. The influx of products from overseas has made it difficult for Americans to compete with cheaper labor worldwide. This has caused an overall reduction of well-paying jobs and lopsided growth of the lower and upper-income brackets.
-
-
When did the middle class start shrinking?
The most significant period of shrinking for the middle class started in 1999. While the middle class has shrunk by 18% since 1971, the most major changes have occurred within the past 20 years.
More specifically, the 2008 Recession had a devastating impact on the US middle class, and now inflation caused by the Pandemic and other factors threaten to shrink the middle class even more.
-
What is the solution to the shrinking middle class?
There is no easy solution to the shrinking middle class, but both political parties in the US do offer ideas. For instance, here are some mainstream ideas that could help to revitalize America’s middle-income bracket:
-
Higher Minimum Wage. The federal minimum wage has remained unchanged from $7.25 since 2009, despite the fact that the cost of living has increased by over 26% since then. Some states have already increased their minimum wage, but a new federal one more in line with current inflation could be beneficial.
-
Infrastructure Investment. This would not only improve the quality of life for all Americans but also provide thousands of quality jobs for those in need.
-
Marginal Tax Rates. Many believe that reducing the tax burden on lower income brackets and shifting it to higher income brackets would help restore balance.
-
Tax Cuts. Many Americans also believe that tax cuts, especially for lower-income brackets, would help encourage a healthier middle class.
-
Conclusion
America’s middle class has been shrinking for over 50 years, at a rate of 18% since 1971. Today, approximately 50% of Americans are middle class, compared to 61% back then.
Unfortunately, the situation might get worse before it gets better. 72% of middle-income families say earnings are falling behind the rising cost of living, and 74% say they are unable to save for the future. This is in part due to current inflation trends, which are very concerning for the average American.
Ultimately, revitalizing the middle class will take innovation and dedication on the part of our society and governments. It may require moves like raising the minimum wage or changing tax policies. Whether or not the country is ready to make changes remains to be seen.
References
-
ABC News – Here’s what income range is considered middle class in 20 U.S. cities
-
The Hill – Here’s what it takes to be middle class
-
CNBC – Amid inflation, more middle-class Americans struggle to make ends meet
-
United States Census Bureau – Census Bureau Releases New Educational Attainment Data
-
BLS – Measuring the value of education
-
Pew Research Center – How the American middle class has changed in the past five decades
-
OECD – Under Pressure The Squeezed Middle Class
Author
Jack Flynn is a writer for Zippia. In his professional career he’s written over 100 research papers, articles and blog posts. Some of his most popular published works include his writing about economic terms and research into job classifications. Jack received his BS from Hampshire College.