- Facts and Figures
- Social Security Statistics
- Social Media Statistics
- Cell Phone Usage Statistics
- Cryptocurrency Statistics
- White Collar Crime Statistics
- Crowdfunding Statistics
- Branding Statistics
- How Many Emails Are Sent Per Day
- Money Laundering Statistics
- Childcare Availability Statistics
- Cold Calling Statistics
- Automation And Job Loss Statistics
- Student Loan Statistics
- Spam Statistics
- Password Statistics
- Ransomware Statistics
- Christmas Spending Statistics
- Average Grocery Cost By State
- Average Screen Time Statistics
- Average Monthly Expenses
- IoT Statistics
- Gen Z Statistics
Research Summary. For over a decade, social media has become an integral part of our daily interactions and experiences. As technology and digital communication continue to evolve, social media usage has surged. Our latest research indicates:
-
As of January 2026, there are 4.9 billion social media users globally, representing over 61% of the world’s population.
-
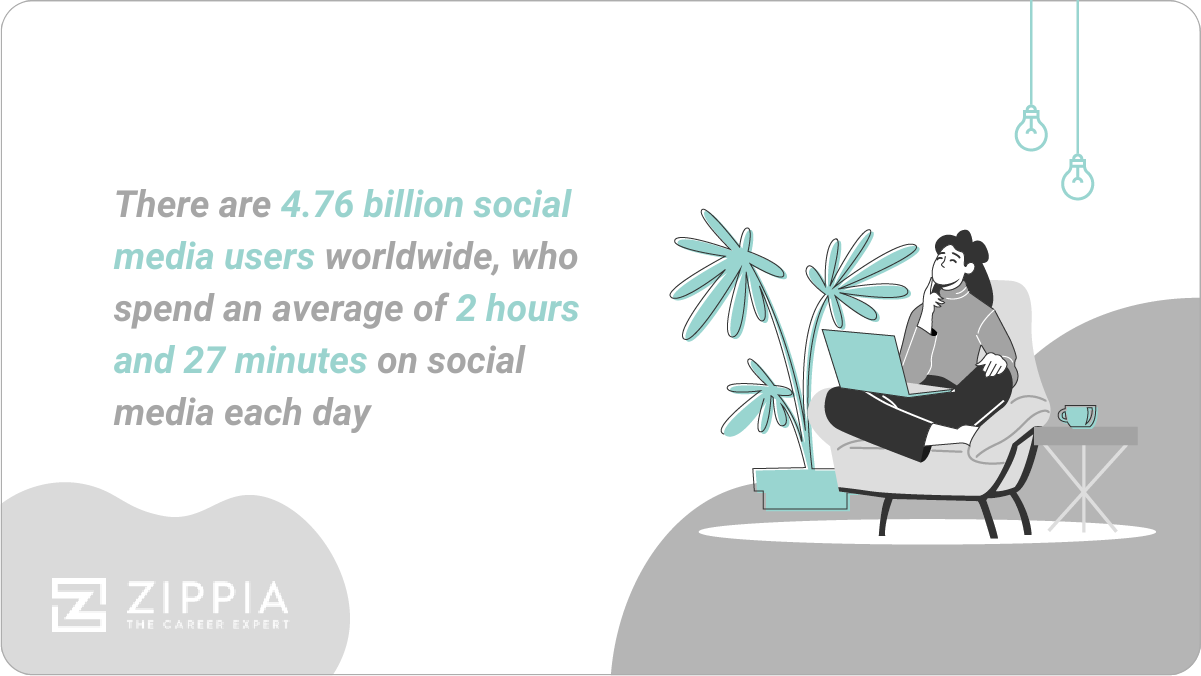
The average user now spends 2 hours and 45 minutes on social media each day.
-
125.3 million Americans access social media exclusively through mobile devices, which is approximately 38% of the U.S. population.
-
A significant 78% of social media users conduct product research on these platforms.
-
73% of consumers who have a positive interaction with a brand on social media are likely to recommend that brand to others.
-
At least 76% of marketers affirm that social media is either “somewhat effective” or “very effective” for their business.
-
As of 2022, there are approximately 1.5 billion active TikTok users, reflecting a 500% year-on-year growth from 2021.
For a deeper dive, we’ve categorized the data as follows:
Social Media Marketing | Facebook | Twitter | Instagram | Other Platforms | Content-Type | Penetration | Demographics | Platform | Trends and Projections
Social Media Statistics by Consumer Behavior
Given that the average user dedicates over 2 hours to social media daily, it’s no surprise that these platforms significantly impact consumer behavior. According to our findings:
-
92% of users visit a brand’s website or app after following them on social media.
This means that if 300 individuals follow your brand on social media, approximately 276 would visit your website, highlighting the importance of social media for product visibility.
-
90% of users are inclined to purchase from a brand they follow on social media.
In this case, if 300 people follow your brand, around 270 would likely make a purchase. Furthermore, 85% of social media users prefer that brand over competitors.
-
45% of internet users rely on social media for brand research.
This figure is even higher in the U.S., reaching up to 75% of internet users.
-
52% of social media users trust influencer recommendations for their purchasing decisions.
This statistic underlines the prevalence of brands investing in influencer partnerships, as recommendations from beloved influencers significantly increase purchase likelihood.
-
87% of social media users follow at least one brand.
This figure rises to 92% among Instagram users, indicating that following brands is commonplace for most social media users.
Social Media Marketing Statistics
As consumers increasingly rely on social media for brand discovery and purchases, marketers strive to capture their attention. Here are key statistics regarding social media marketing:
-
93.2% of U.S. companies with more than 100 employees leverage social media for marketing.
This figure illustrates that marketers have recognized the potential of social media for over a decade.
-
95% of social media marketers invest in Facebook ads.
This is logical, given that 80% of American consumers have discovered new retail products through Facebook, leading to widespread ad personalization.
-
99% of marketers consider Instagram as the most impactful platform for influencer marketing.
In comparison, only 55% acknowledge the same for Facebook, largely due to Instagram’s visually driven format.
-
Social media ad spending in the U.S. reached $72.5 million in 2025.
This marks a 45% increase from 2022, highlighting the growing importance of social media advertising.
-
70% of B2B businesses utilize Twitter for digital marketing.
While typically lower than Facebook and Instagram, 70% is still a significant majority.
Social Media Statistics on Facebook
With over 3 billion users globally, Facebook remains the largest social network. Here are crucial statistics specifically about Facebook:
-
As of 2023, there are over 80 million active Facebook pages.
However, only 7 million of these pages are active advertisers, which accounts for most of the 2 billion views they receive.
-
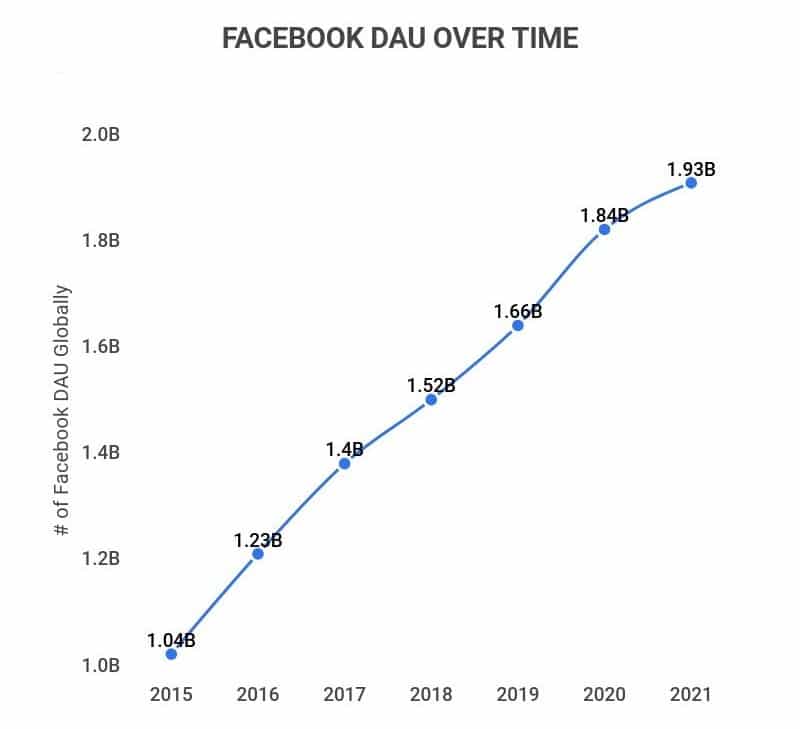
Facebook has 2 billion daily active users (DAU) as of 2023.
When compared to other social media platforms, Facebook excels in DAU, with 70% of monthly active users accessing the site daily. This translates to 25% of the global population using Facebook every day.
-
Facebook had 3.1 billion monthly active users in early 2023.
With a continuous quarterly increase, this number rises each year.
-
As of 2023, 70% of U.S. adults use Facebook.
This reflects a steady increase from previous years, demonstrating Facebook’s enduring popularity.
-
The average engagement rate for a Facebook post is around 0.25%.
This low rate is likely due to the intense competition among users and pages. Notably, the highest engagement days on Facebook are Tuesday, Wednesday, and Thursday.
-
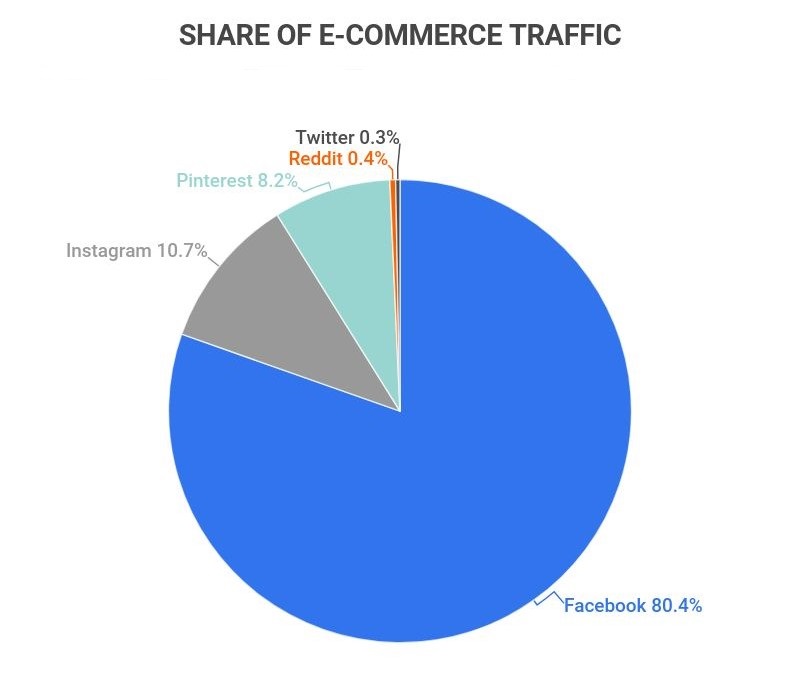
85% of e-commerce referrals from social media are generated via Facebook.
Facebook leads in social media referral traffic, followed by Instagram at 12% and Pinterest at 10%.
-
On average, users share around 5 billion pieces of content daily on Facebook.
This means that the average user shares approximately 3 pieces of content every day.
Social Media Statistics on Twitter
Though not as widely used as Facebook, Twitter remains a significant player in the social media landscape. Here are some key facts about Twitter:
-
80% of Twitter users have a more favorable view of brands that engage with them in tweets.
This engagement fosters a positive brand image, highlighting the platform’s potential in customer service and interaction.
-
Twitter is utilized by 300 heads of state and governments.
The platform is the preferred medium for 90% of all United Nations member states, used across 180 countries.
-
Over 500 million tweets are sent daily on Twitter.
This equates to approximately 200 billion tweets annually, showcasing the platform’s dynamic nature.
-
88% of Twitter users access the site via mobile devices.
In contrast, Facebook has a user split of 68/32 for mobile and desktop access.
-
90% of U.S. tweets are generated by just 10% of users.
This statistic explains the perception of certain individuals dominating the conversation on Twitter.
Social Media Statistics on Instagram
As the fourth largest social media platform, Instagram plays a pivotal role in both cultural trends and advertising. Here are some statistics about Instagram:
-
Instagram boasts approximately 1.5 billion monthly active users.
However, about 600 million use the platform daily, which is significantly lower than Facebook’s daily user count.
-
As of 2022, there are over 700 million Instagram Stories users.
This marks a significant growth from previous years, reflecting the popularity of ephemeral content.
-
Roughly 100 million photos are posted on Instagram each day.
Since its inception, over 50 billion photos have been shared on the platform, illustrating its massive user engagement.
Social Media Statistics by Other Platforms
While we’ve discussed major platforms, many others are noteworthy. Here are statistics on additional leading social media networks:
| Network | Number of Users (In Millions) |
|---|---|
| 3,000 | |
| YouTube | 2,500 |
| 2,200 | |
| 1,500 | |
| Facebook Messenger | 1,500 |
| 1,400 | |
| TikTok | 1,500 |
| Douyin | 700 |
| 600 | |
| Sina Weibo | 590 |
| Telegram | 580 |
| Snapchat | 550 |
| Kuaishou | 520 |
| 480 | |
| 440 | |
| 430 |
-
TikTok currently has approximately 1.5 billion monthly active users.
This rapid growth is impressive, especially considering that TikTok was launched in 2016, showcasing its ability to capture a significant audience quickly.
-
As of 2022, Reddit has 440 million monthly active users.
Founded in 2005, Reddit remains a popular platform with around 14 million daily visitors.
-
Pinterest has around 460 million active users as of 2022.
This indicates a consistent user base, with a substantial number accessing the platform from outside the U.S.
-
Facebook remains the most popular social media site with over 3 billion users worldwide.
This is a considerable lead over YouTube, which has about 2.5 billion users.
-
WhatsApp, Facebook Messenger, and WeChat collectively account for over 4.5 billion users.
As essential messaging apps, their roles in communication continue to grow, with WhatsApp having 2.2 billion users, Facebook Messenger at 1.5 billion, and WeChat at 1.4 billion.
Social Media Statistics by Content Type
With billions of users engaged daily, creating standout posts is crucial. Here are notable insights regarding content on these platforms:
-
Posts with images receive up to 130% more engagement than text-only posts.
This includes 55% more likes and 110% more comments. Additionally, photo posts lead to 90% more click-throughs on external links compared to text posts.
-
92% of consumers favor visual content over text or static media.
Interactive content, such as videos and visuals, attracts consumers the most, contributing to the dominance of online video advertising.
-
Video content now accounts for nearly 85% of internet traffic.
This statistic highlights the importance of platforms like YouTube in driving heavy traffic, even as many viewers watch videos with the sound off.
-
Instagram videos generate 25% more interactions than photos.
Despite the popularity of images, videos outperform both photos and carousel posts in engagement.
-
Approximately 50% of all social media posts are link posts.
Link posts are the most common type of content brands use, often accompanied by photos or videos to encourage clicks.
Social Media Statistics by Penetration
As of 2026, social media is ubiquitous, with nearly everyone aware of or using these platforms. It’s astonishing to consider that just two decades ago, they didn’t exist. Our research shows:
-
94% of global internet users engage with social media.
Additionally, as of 2026, 42% of all internet users utilize social media for work-related tasks.
-
Europe leads in social media penetration at 81%.
North America follows closely with a penetration rate of 78%. Asia’s rates vary widely due to differing usage patterns among countries.
-
The UAE (United Arab Emirates) boasts the highest social media penetration at 99%.
South Korea and Taiwan follow with 90% and 88% penetration rates, respectively.
-
Internet users dedicate over 38% of their online time to social media.
The average person spends 7 hours and 15 minutes online, with approximately 2 hours and 45 minutes on social media.
| Country | % Of Population That Uses Social Media |
|---|---|
| UAE | 99% |
| South Korea | 90% |
| Taiwan | 88% |
| Netherlands | 88% |
| Malaysia | 86% |
| Hong Kong | 85% |
| Canada | 84% |
| Singapore | 84% |
| Denmark | 84% |
| Sweden | 82% |
| New Zealand | 82% |
| Switzerland | 81% |
| Philippines | 80% |
| Spain | 80% |
| Australia | 80% |
| Austria | 79% |
| Saudi Arabia | 79% |
| Argentina | 79% |
| Thailand | 79% |
| Germany | 78% |
| Israel | 78% |
| UK | 78% |
| Mexico | 77% |
| Portugal | 76% |
| Colombia | 76% |
| Ireland | 76% |
| Belgium | 76% |
| France | 75% |
| Japan | 75% |
| Vietnam | 74% |
| United States | 73% |
| Turkey | 71% |
| Brazil | 71% |
| Poland | 70% |
| Italy | 69% |
| Russia | 68% |
| China | 66% |
| Romania | 65% |
| Indonesia | 63% |
| Morocco | 60% |
Social Media Statistics by Demographics
Understanding who uses social media and their motivations is crucial. Our research indicates:
-
90% of U.S. Millennials engage with social media daily.
Only Gen Z surpasses this, with 92% daily usage. Baby boomers follow at 88% and Gen X at 82%.
-
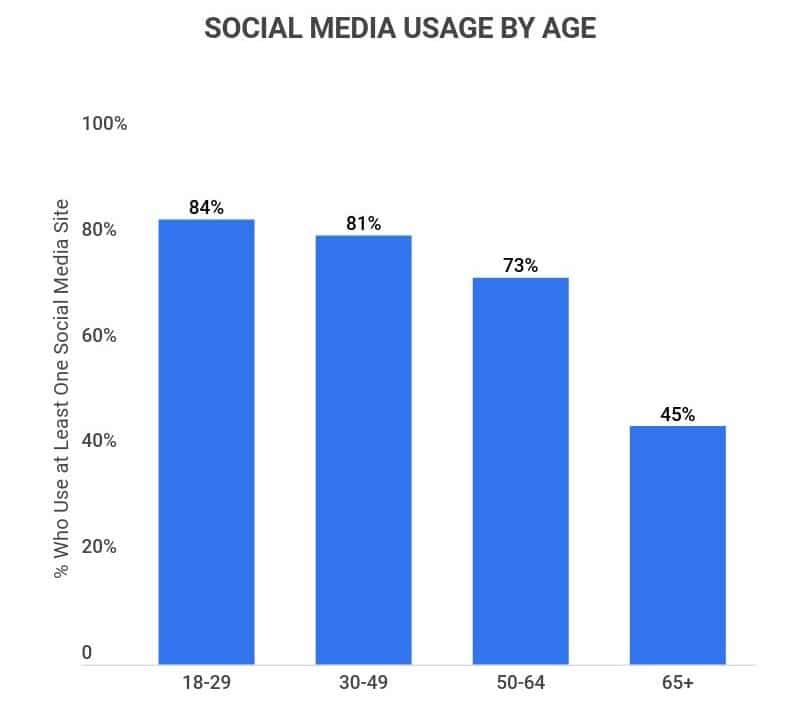
In the U.S., 85% of individuals aged 18-29 use social media.
This percentage declines with age: 80% for those 30-49, 75% for 50-64, and 50% for 65+.
-
Hispanic and Latino individuals are the most active users in the U.S., with 85% using at least one platform.
Black Americans follow at 80%, while 70% of White Americans engage with social media.
-
Women are 18% more likely to use social media than men.
82% of American women use at least one site, compared to 64% of men.
-
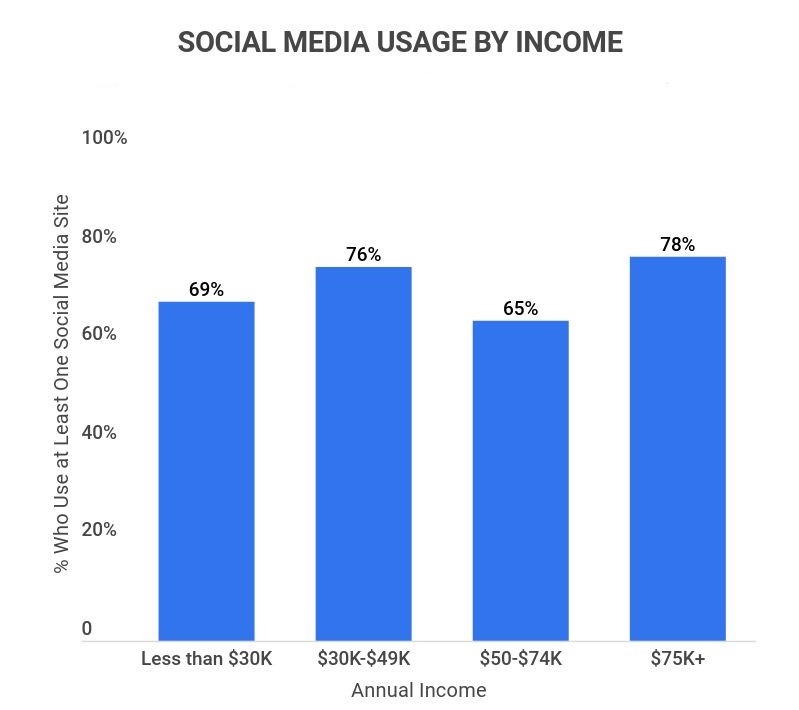
Individuals earning $75K or more are more likely to use social media, with 82% engagement.
This percentage drops to 70% for those earning under $30K.
-
77% of college graduates engage with at least one social media platform.
This figure is slightly lower for those who completed or did not finish high school, at 65%.
-
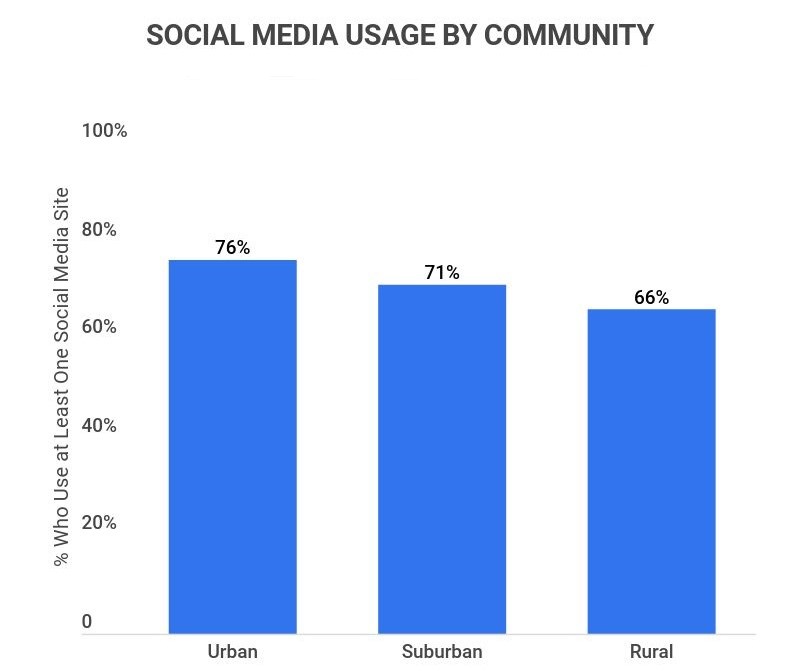
Urban residents are more likely to use social media, with 78% engagement.
In suburban areas, 73% use social media, while only 66% of rural residents do.
Social Media Statistics by Platform
As noted, not all social media platforms share equal popularity. While Facebook and Messenger are leaders, numerous niche platforms exist. Our research reveals:
-
YouTube is the most widely used social media platform in the U.S., with 85% of adults active on it.
Next is Facebook at 70%, followed by Instagram (45%), Pinterest (33%), LinkedIn (30%), and Snapchat (28%).
-
Men utilize LinkedIn more than women, while women are more active on Facebook and Instagram.
80% of women use Facebook compared to 62% of men, and 48% of women use Instagram versus 36% of men. Conversely, 34% of men engage with LinkedIn, compared to 29% of women.
-
The average U.S. internet user maintains 9 social media accounts.
This number varies globally, with India averaging 12.5 accounts per user and Japan at 4.
-
Instagram boasts the highest engagement rate of any platform at 3-8% per post.
Though it may seem modest, Facebook often sees less than 1% engagement per post, making Instagram’s numbers impressive. With 600 million daily users, each post may garner up to 40 million engagements.
Social Media Statistics Trends and Projections
Social media’s influence continues to grow, and its usage is expected to expand further. Here are some noteworthy trends and forecasts:
-
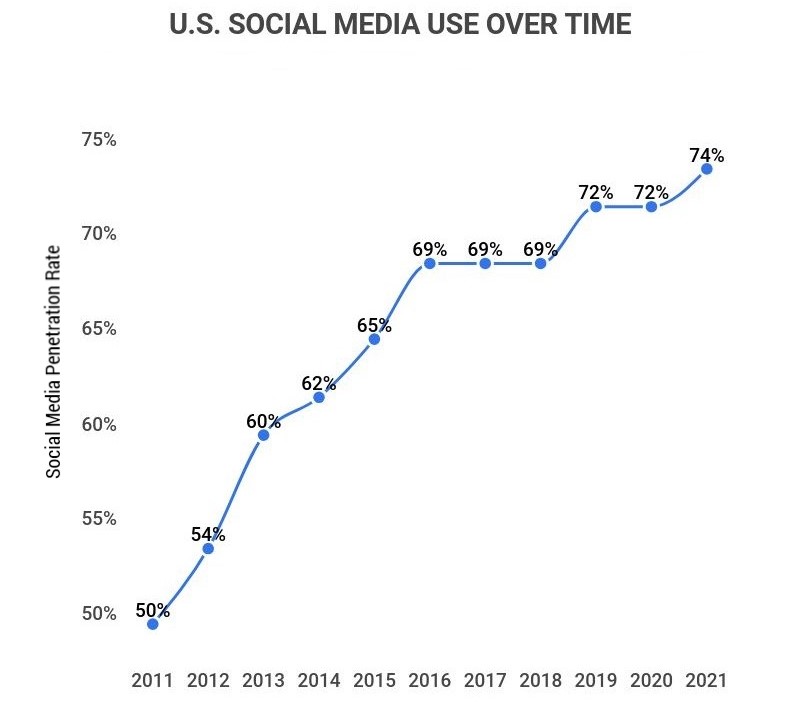
From 2005 to 2023, social media usage among U.S. adults has surged nearly 16 times.
In 2005, just 5% of adults engaged with social media; by 2023, this number soared to 73%, with the most significant rise occurring from 2008 to 2010.
-
Between 2023 and 2024, the number of social media users globally is projected to increase by 200 million.
Since 2017, nearly 2.5 billion new users have joined social media platforms.
-
By 2027, there are expected to be over 5 billion social media users worldwide.
This represents a 19% growth from 2023, during which there were about 4.9 billion users.
Social Media Statistics FAQ
-
What percentage of the world is on social media?
As of 2026, approximately 61% of the global population is active on social media. This equates to about 4.9 billion social media users worldwide.
While the United States does not have the highest percentage, 73% of the population engages with social media. The UAE maintains the highest penetration rate at 99%.
-
What are the advantages and disadvantages of social media?
Social media offers numerous advantages and disadvantages, including:
Advantages
-
Ability to connect with communities and reach large audiences
-
Opportunity to create engaging and unique content
-
Access to education and information
-
Marketing and brand visibility
Disadvantages
-
Bullying and harassment
-
Privacy concerns
-
Addiction and impaired sleep
-
Exposure to misinformation
-
-
Not necessarily; social media can be harmful when unhealthy or addictive habits develop. Nevertheless, it also serves many beneficial purposes. While children may not be well-suited for frequent social media use, most adults can navigate its challenges effectively. Many individuals create successful careers as content creators and influencers.
-
What age group uses social media the most?
Globally, individuals aged 20 to 29 represent the largest demographic of social media users (32.2%). Social media is particularly popular among younger adults.
In the U.S., 85% of those aged 18-29 engage with at least one platform, compared to 75% for those 30-49 and 50% for those 65+.
Conclusion
Since just 5% of the American population utilized social media in 2005, the landscape has transformed dramatically. Today, nearly three-quarters of Americans and over half of the global population engage with these platforms. Major players like Facebook and YouTube dominate, with 3 billion and 2.5 billion users, respectively.
Social media serves diverse purposes, from communication to marketing. Approximately 76% of marketers find social media to be “somewhat effective” or “very effective” for their business, with brands leveraging platforms like Instagram for engagement and customer conversion.
Anticipated growth remains strong, with projections indicating potential growth to over 5 billion users by 2027. The surge of 200 million new users projected for 2024 underscores the continuing expansion of social media’s influence.
References
-
Sprout Social Index. “Above and Beyond.” Accessed on January 31st, 2022.
-
Statista. “Social media marketing usage rate in the United States from 2013 to 2026.” Accessed on January 31st, 2022.
-
Oberlo. “Social Media Ad Spend in the US (2017–2026).” Accessed on January 31st, 2022.
-
Statista. “Twitter marketing – statistics & facts.” Accessed on January 31st, 2022.
-
Statista. “Number of daily active Facebook users worldwide as of 3rd quarter 2023.” Accessed on January 31st, 2022.
-
Pew Research Center. “10 facts about Americans and Facebook.” Accessed on January 31st, 2022.
-
Statista. “Share of retail e-commerce traffic in referred by leading social media as of 1st quarter 2019.” Accessed on January 31st, 2022.
-
Cision. “Twitter is the Prime Social Media Network for World Leaders.” Accessed on January 31st, 2022.
-
David Sayce. “The Number of tweets per day in 2020.” Accessed on January 31st, 2022.
-
MediaKix. “How Many People Use Instagram Stories? [User Growth Chart].” Accessed on January 31st, 2022.
-
Statista. “Number of daily active users (DAU) of the Reddit app worldwide from 1st quarter 2018 to 3rd quarter 2023.” Accessed on January 31st, 2022.
-
Statista. “Number of monthly active Pinterest users from 1st quarter 2016 to 2nd quarter 2023, by region.” Accessed on January 31st, 2022.
-
Statista. “Most popular social networks worldwide as of October 2023, ranked by number of active users.” Accessed on January 31st, 2022.
-
Forbes. “Visual Content: The Future Of Storytelling.” Accessed on February 1st, 2022.
-
University of Maine. “Social Media Statistics Details.” Accessed on February 1st, 2022.
-
Statista. “Global social network penetration rate as of January 2023, by region.” Accessed on February 1st, 2022.
-
Statista. “Active social network penetration in selected countries and territories as of January 2023.” Accessed on February 1st, 2022.
-
The Manifest. “How Different Generations Use Social Media.” Accessed on February 1st, 2022.
-
Pew Research Center. “Social Media Fact Sheet.” Accessed on February 1st, 2022.
-
Statista. “Number of social network users worldwide from 2017 to 2027.” Accessed on February 1st, 2022.
-
DataReportal. “Global Social Media Statistics.” Accessed on February 23rd, 2023.
-
Oberlo. “How Much Time Does the Average Person Spend on Social Media (2012-2026).” Accessed on February 23rd, 2023.
-
Oberlo. “10 Social Media Statistics You Need to Know in 2026 (Infographic).” Accessed on February 23rd, 2023.
- Facts and Figures
- Social Security Statistics
- Social Media Statistics
- Cell Phone Usage Statistics
- Cryptocurrency Statistics
- White Collar Crime Statistics
- Crowdfunding Statistics
- Branding Statistics
- How Many Emails Are Sent Per Day
- Money Laundering Statistics
- Childcare Availability Statistics
- Cold Calling Statistics
- Automation And Job Loss Statistics
- Student Loan Statistics
- Spam Statistics
- Password Statistics
- Ransomware Statistics
- Christmas Spending Statistics
- Average Grocery Cost By State
- Average Screen Time Statistics
- Average Monthly Expenses
- IoT Statistics
- Gen Z Statistics
Author
Chris Kolmar is a co-founder of Zippia and the editor-in-chief of the Zippia career advice blog. He has hired over 50 people in his career, been hired five times, and wants to help you land your next job. His research has been featured on the New York Times, Thrillist, VOX, The Atlantic, and a host of local news. More recently, he's been quoted on USA Today, BusinessInsider, and CNBC.