Research Summary. Southwest Airlines has established itself as one of the leading domestic airlines in the United States since its inception in 1971. Originally a small Texas-based carrier, Southwest has evolved into a major player in the aviation industry. The following key statistics are essential for customers, employees, and investors to consider when evaluating Southwest Airlines:
-
In 2022, Southwest Airlines served 123.3 million passengers.
-
The airline employs over 55,100 staff members.
-
As of 2023, Southwest Airlines operates a fleet of 741 aircraft.
-
In 2022, Southwest Airlines generated $15.8 billion in revenue.
For a deeper dive into the data, we’ve organized it into the following categories:
Flights and Destinations | Passengers | Company Stats | Trends

Southwest Airlines Statistics by Flights and Destinations
-
Southwest Airlines serves 121 destinations.
Despite being primarily a domestic airline, Southwest offers a diverse range of locations, providing customers with numerous options. A significant factor in Southwest’s growth has been its expansion into new markets.
-
Southwest Airlines operates in 11 countries.
Within the U.S., the airline serves 42 states, as well as Washington D.C. and Puerto Rico. Internationally, Southwest serves ten additional countries, including Mexico, Jamaica, the Bahamas, Aruba, the Dominican Republic, Costa Rica, Belize, Cuba, the Cayman Islands, and the Turks and Caicos Islands, highlighting its continued expansion efforts.
-
In 2022, Southwest Airlines averaged nearly 3,000 flights per day.
For the year, the total flight count reached 1,066,934, a notable increase from 897,540 flights in 2021, although still below the pre-pandemic level of 1,367,727 flights in 2019.
-
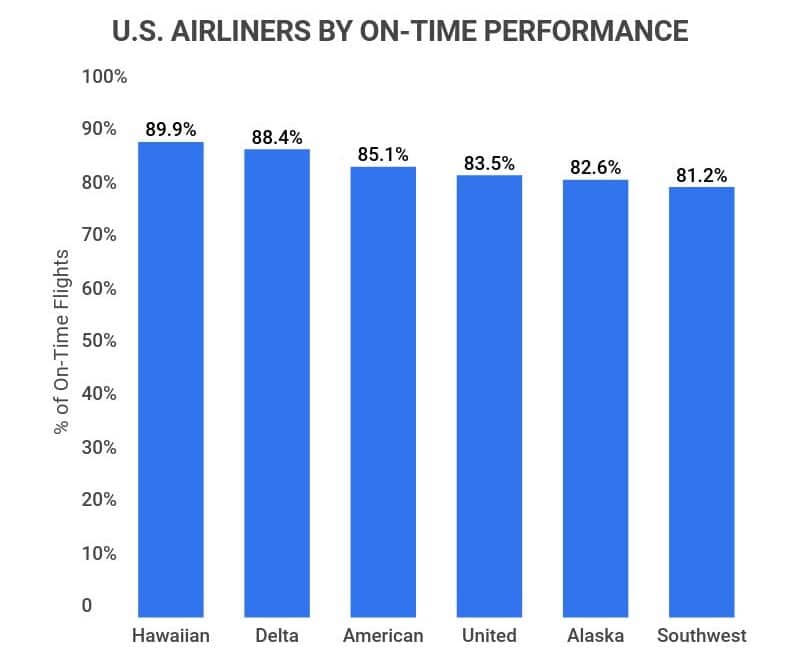
81.2% of Southwest flights in 2022 were on time.
This statistic underscores Southwest Airlines’ commitment to reliability and punctuality, which are crucial for maintaining customer satisfaction and loyalty. As a domestic airline, Southwest must prioritize customer needs while competing with larger carriers.
Southwest Airlines Statistics by Passengers
-
In 2022, Southwest’s average passenger load factor was 78.5%.
This occupancy rate reflects a recovery from the low of 52.4% in 2020 and approaches the 2019 level of 83.5%, indicating a strong rebound in air travel.
-
Southwest’s loyalty program generated $2.1 billion in revenue in 2022.
The airline has effectively leveraged its loyalty program to encourage repeat business and enhance revenue, positioning it as a cornerstone of their business strategy.
-
Southwest employs over 12,600 freight agents, with freight revenue totaling $187 million in 2022.
While not the primary focus of Southwest Airlines, freight services contribute to diversifying the airline’s revenue streams, reinforcing its stability within the economic supply chain.
Southwest Airlines Company Statistics
-
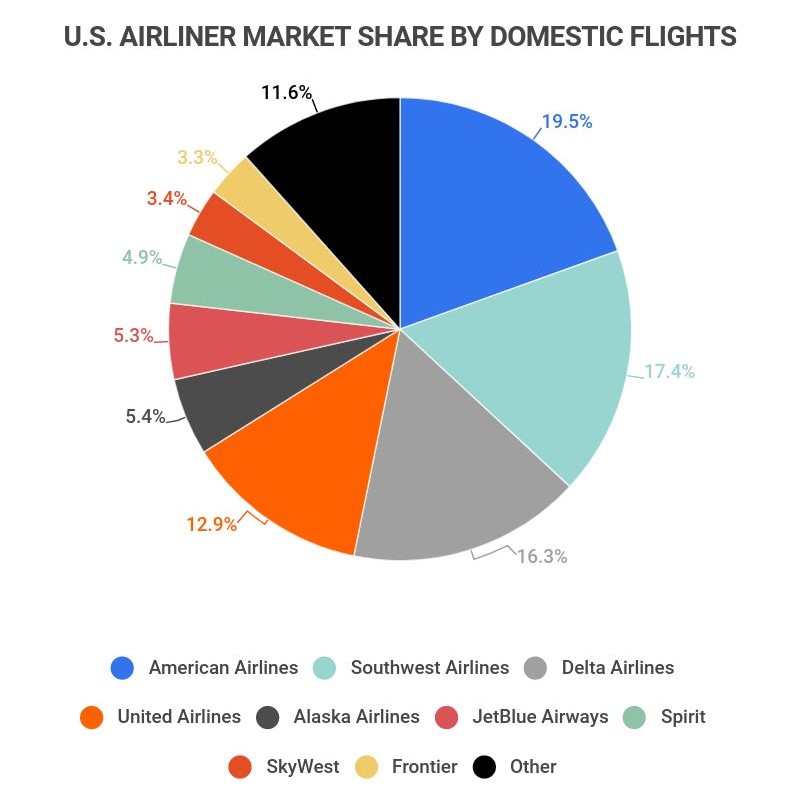
Southwest holds a 17.5% share of domestic revenue passenger miles.
This positions Southwest as the second-largest airline in the U.S. market, trailing American Airlines, which commands an 18.6% share. Delta and United Airlines follow with 16.6% and 13.2% shares, respectively, highlighting Southwest’s competitive edge.
-
As of April 2023, Southwest is valued at approximately $23 billion.
Although the airline faced valuation declines during the pandemic, it has made significant strides in recovery, reflecting investor confidence in its business model.
-
Southwest was ranked 336 by Fortune 500.
While this reflects a decline from its pre-pandemic ranking of 141, it remains a testament to Southwest Airlines’ resilience and industry presence.
Southwest Airlines Trends
-
The occupancy rate of Southwest Airlines has nearly returned to pre-pandemic levels.
This trend is evident in the following occupancy rate data:
Occupancy Rate by Year
Year Occupancy Rate 2021 78.5% 2020 52.4% 2019 83.5% 2018 83.4% 2017 83.9% 2016 84% -
Domestic travel continues to dominate Southwest Airlines’ passenger totals.
Passenger levels over the past decade show significant increases in both domestic and international travel:
Number of Passengers for Domestic and International Flights
Year Domestic Flights – Passengers International Flights – Passengers Total 2022 N/A N/A N/A 2021 120,699,197 2,019,347 122,718,544 2020 66,599,890 1,185,346 67,785,236 2019 158,418,529 4,262,482 162,681,011 2018 159,044,969 4,560,630 163,605,599 2017 153,809,012 3,867,925 157,676,937 2016 148,820,598 2,919,679 151,740,277 2015 142,407,578 2,167,028 144,574,606 2014 126,694,783 499,767 127,194,550 2013 115,322,785 0 115,322,785 2012 112,234,074 0 112,234,074 -
Annual revenue in 2022 remains below pre-pandemic levels.
Despite a rebound from 2020 to 2021, revenue still lags behind figures from before the pandemic:
Southwest Revenue Each Year (in billions)
Year Revenue (billions) 2022 N/A 2021 $15.8 2020 $7.82 2019 $20.94 2018 $20.62 2017 $19.31 2016 $18.76 2015 $18.47 2014 $17.83 2013 $16.88 2012 $16.25 -
Passenger numbers are gradually recovering post-pandemic.
However, there remains a -24.21% difference between 2019 and 2021 passenger totals:
Passenger Numbers Each Year
Year Passenger Count (millions) % Change 2022 N/A N/A 2021 123.3 81.88% 2020 67.8 -58.33% 2019 162.7 N/A -
Flights per day in 2022 exceeded those of 2021 but remain lower than pre-pandemic levels.
Southwest Flights Per Day
Year Total Flights Per Day Avg. % Change 2022 N/A N/A N/A 2021 1,066,934 2,923 15.88% 2020 897,540 2,459 -34.38% 2019 1,367,727 3,747 N/A -
2020 marked the first year Southwest Airlines recorded a net income loss.
This is significant, considering the volatility inherent in the airline industry. Below is the net income data:
Year Income/Loss (billions) 2012 N/A 2021 $1.75 2020 -$3.95 2019 $3.04 2018 $3.25 2017 $3.31 2016 $3.62 2015 $3.57 2014 $1.92 2013 $1.31 2012 $0.81
Southwest Airlines Statistics FAQ
-
How many people fly with Southwest Airlines each year?
In 2022, 123.3 million people flew with Southwest Airlines. On average, about 130 million passengers travel with Southwest each year. The drop to 67.8 million in 2020 was significant, due to the pandemic.
2018 remains Southwest Airlines’ peak year with 163.6 million passengers.
-
Is Southwest Airlines the most popular airline in the United States?
Southwest Airlines is among the most popular airlines in the United States. With a 17.5% market share, Southwest ranks second after American Airlines. It is also recognized for its reliability, ranking sixth in punctuality in 2021.
-
How many people work for Southwest Airlines?
55,100 employees work for Southwest Airlines. This includes 23,500 in flight operations, 3,200 in maintenance, 21,000 in ground services, and 7,400 in administration. These numbers do not include contract or part-time staff.
-
How much is Southwest Airlines worth?
As of April 2023, Southwest Airlines is valued at approximately $23 billion. The average market valuation over the past five years has hovered around $27 billion, influenced by the pandemic’s impact on the industry. The peak valuation occurred in January 2018, at about $39 billion.
-
How many aircraft does Southwest Airlines have?
Southwest Airlines operates 741 aircraft. Of these, 599 are owned and the remaining 129 are leased, enabling the airline to maintain a robust and diverse service network.
-
What is Southwest Airlines’s annual revenue?
In 2022, Southwest Airlines reported annual revenue of $15.8 billion. This was a recovery from the $7.82 billion in 2020, which was the lowest in a decade. The highest revenue year was 2019, when they achieved $20.94 billion.
While on the path to recovery, Southwest still aims to surpass pre-pandemic revenue levels.
Conclusion
Southwest Airlines remains a pivotal player in the aviation industry. From its humble beginnings as a regional carrier in Texas, it has grown to dominate the domestic market, effectively competing with larger airlines like American and Delta Airlines.
Although the airline faced significant challenges during the pandemic, it is on a recovery path with increasing revenue, flights, and passenger numbers. However, it still has work to do to reach pre-pandemic levels.
Southwest’s future appears promising, given its extensive network of destinations, reliable services, and solid financial performance, which continue to attract customers and investors alike, creating a positive feedback loop that contributes to its growth.
Having achieved profitability in every year except 2020, Southwest Airlines is well-positioned to navigate the evolving landscape of the domestic airline industry in the 21st century.
References
-
SEC. “Southwest Airlines 10-K SEC Form.” Accessed April 21, 2023.
-
Travel Awaits. “You’ll Face Fewer Delays If You Fly These 6 U.S. Airlines.” Accessed April 21, 2023.
-
United States Department of Transportation. “Bureau of Transportation Statistics.” Accessed April 21, 2023.
-
YCharts. “Southwest Airlines Co (LUV).” Accessed April 21, 2023.
-
Statista. “Southwest Airlines’ passenger load factor from 2011 to 2021.” Accessed April 21, 2023.
-
Companies Market Cap. “Revenue for Southwest Airlines (LUV).” Accessed April 21, 2023.
-
Investopedia. “Analyzing Southwest Airlines’ (LUV) Market Share.” Accessed April 21, 2023.
-
Statista. “Southwest Airlines – Statistics & Facts.” Accessed April 21, 2023.
Author
Conor McMahon is a writer for Zippia, with previous experience in the nonprofit, customer service and technical support industries. He has a degree in Music Industry from Northeastern University and in his free time he plays guitar with his friends. Conor enjoys creative writing between his work doing professional content creation and technical documentation.