The state with the highest debt per person is Massachusetts, averaging $11,171 per resident.
The state with the lowest debt is Tennessee, where the average debt per person is only $893.
Total personal debt across the United States has reached an impressive $14.96 trillion.
77% of American households carry some form of debt.
The trend of increasing state debts continues into 2026. State governments face various expenses such as education, infrastructure, healthcare, and social welfare programs. When revenue falls short of projected budgets, states often incur debt to maintain operations.
However, the burden of debt is not distributed equally among states. Some states have made substantial investments in social programs, while others have opted for tax cuts without proportional revenue increases. This analysis evaluates the data to identify the states with the highest debt relative to their population size:
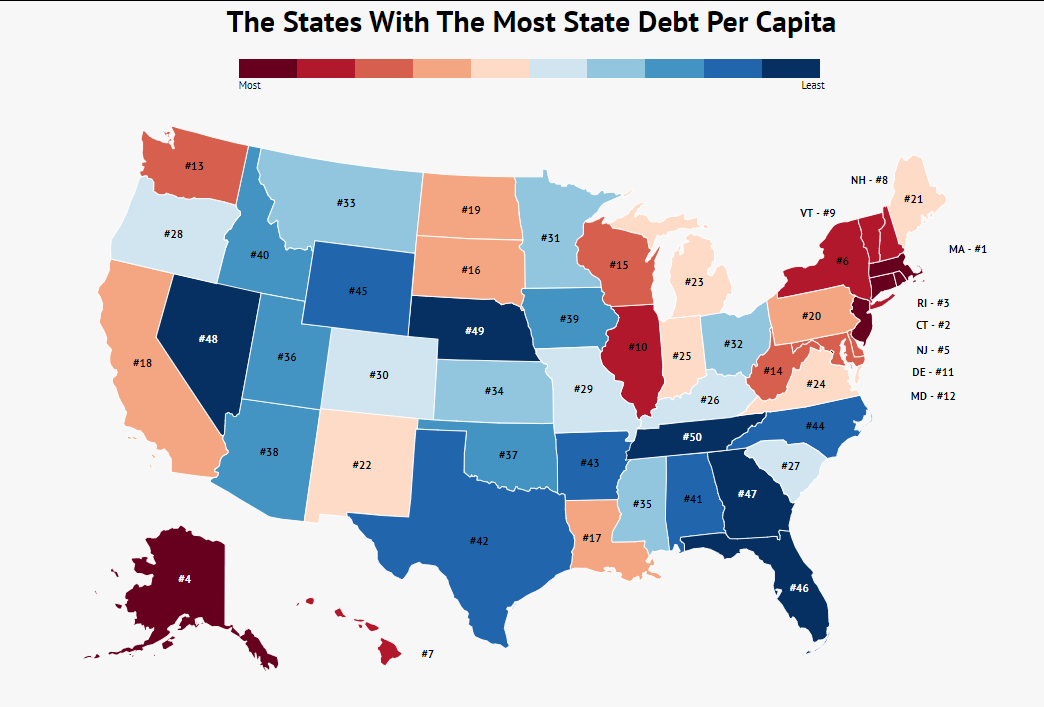
Here are the 10 states with the most state debt per capita:
- Massachusetts
- Connecticut
- Rhode Island
- Alaska
- New Jersey
- New York
- Hawaii
- New Hampshire
- Vermont
- Illinois
Massachusetts ranks first with a state debt per capita of $11,171, making it the most indebted state government relative to its population size. Notably, while California has the largest total debt due to its substantial population, this translates to a per capita debt of only $3,867—slightly above North Dakota’s.
Here are the 10 states with the least state debt per capita:
Many southern states, characterized by limited social programs and weaker unemployment benefits, dominate the list of states with the least debt. All of these states maintain debt levels below $2,000 per capita.
Check Out The Full List: All 50 States Ranked From Most Debt Per Person To Least
| Rank | State | Debt Per Capita |
|---|---|---|
| 1. | Massachusetts | $11,171 |
| 2. | Connecticut | $10,882 |
| 3. | Rhode Island | $8,401 |
| 4. | Alaska | $8,065 |
| 5. | New Jersey | $7,419 |
| 6. | New York | $7,155 |
| 7. | Hawaii | $6,850 |
| 8. | New Hampshire | $5,662 |
| 9. | Vermont | $5,609 |
| 10. | Illinois | $4,876 |
| 11. | Delaware | $4,723 |
| 12. | Maryland | $4,631 |
| 13. | Washington | $4,386 |
| 14. | West Virginia | $4,184 |
| 15. | Wisconsin | $4,001 |
| 16. | South Dakota | $3,956 |
| 17. | Louisiana | $3,893 |
| 18. | California | $3,867 |
| 19. | North Dakota | $3,805 |
| 20. | Pennsylvania | $3,710 |
| 21. | Maine | $3,570 |
| 22. | New Mexico | $3,386 |
| 23. | Michigan | $3,354 |
| 24. | Virginia | $3,256 |
| 25. | Indiana | $3,238 |
| 26. | Kentucky | $3,223 |
| 27. | South Carolina | $3,049 |
| 28. | Oregon | $3,011 |
| 29. | Missouri | $2,997 |
| 30. | Colorado | $2,952 |
| 31. | Minnesota | $2,907 |
| 32. | Ohio | $2,865 |
| 33. | Montana | $2,619 |
| 34. | Kansas | $2,574 |
| 35. | Mississippi | $2,520 |
| 36. | Utah | $2,339 |
| 37. | Oklahoma | $2,148 |
| 38. | Arizona | $1,964 |
| 39. | Iowa | $1,933 |
| 40. | Idaho | $1,902 |
| 41. | Alabama | $1,794 |
| 42. | Texas | $1,758 |
| 43. | Arkansas | $1,590 |
| 44. | North Carolina | $1,554 |
| 45. | Wyoming | $1,382 |
| 46. | Florida | $1,340 |
| 47. | Georgia | $1,233 |
| 48. | Nevada | $1,038 |
| 49. | Nebraska | $1,033 |
| 50. | Tennessee | $893 |
How We Determined the States with the Most Debt
The methodology for this analysis is straightforward. We utilized data on each state’s debt in billions sourced from reliable financial databases and reports. This assessment focuses on government debt only, excluding personal debt such as mortgages or credit card balances.
We then compared this debt against the most recent population estimates. Higher per capita debt indicates a more indebted state relative to its residents.
Summary of the 10 States with the Most Debt
In conclusion, the ten states with the most debt per capita, from Massachusetts to Illinois, exhibit a higher financial burden on their residents compared to other states. These states typically have more comprehensive social support systems in place.
Conversely, states with the least debt predominantly come from the southern region, often reflecting fewer social safety nets. Keep in mind that these figures are not adjusted for cost of living, which can vary significantly across different states and even within regions of the same state.
Additionally, it’s important to note that the data referenced here is current as of 2026 and reflects the ongoing economic impacts influenced by recent policy changes and social conditions.
Author
Kathy is the head of content at Zippia with a knack for engaging audiences. Prior to joining Zippia, Kathy worked at Gateway Blend growing audiences across diverse brands. She graduated from Troy University with a degree in Social Science Education.