- Industry Statistics
- Wedding Industry Statistics
- Yoga Industry Statistics
- Music Industry Statistics
- Landscaping Industry Statistics
- Bicycle Industry Statistics
- Coffee Industry Statistics
- Car Rental Industry Statistics
- Home Improvement Industry Statistics
- Insurance Industry Statistics
- Supplements Industry Statistics
- Golf Industry Statistics
- Fitness Industry Statistics
- US Media And Entertainment Industry Statistics
- Firearm Industry Statistics
- Financial Services Industry Statistics
- Health And Wellness Industry Statistics
- Trucking Industry Statistics
- Wine Industry Statistics
- Pet Industry Statistics
- Mobile App Industry Statistics
- Digital Marketing Industry Statistics
- Hotel Industry Statistics
- Retail Statistics
- Robotics Industry Statistics
- Jewelry Industry Statistics
- Appointment Scheduling statistics
- Restaurant Industry Statistics
- Food Delivery Statistics
- Food Truck Industry
- Fashion Industry
- Real Estate Industry
- US Film Industry
- US Beverage Industry
- USu202fFast Food Restaurants
- US Construction Industry
- US Book Industry
- Cosmetics Industry
- US Food Retail Industry
- US Pharmaceutical Industry
- US Healthcare Industry
- Airline Industry
- Automobile Industry
- Transportation Industry Statistics
- Event Industry Statistics
- Project Management Statistics
- Oil And Gas Industry Statistics
- Nursing Home Statistics
- Nursing Shortage Statistics
- Nursing Statistics
25 Appetizing U.S. Food Retail Industry Statistics [2026]: Insights on the Stores Where We Shop
Research Summary. From grocery stores to food service facilities, the food retail industry is an essential part of our daily lives. Most of us have frequented stores like Walmart, CVS, or our local grocery chains. But what is the true scale of the food industry in the United States? After extensive research, we’ve compiled the most compelling grocery store industry statistics:
-
The annual sales for the food retail industry reached an estimated $1.2 trillion in 2025.
-
There are approximately 66,500 supermarkets and grocery stores in the United States.
-
Food retail industry sales have seen significant growth, amounting to $8.2 trillion today.
-
The average American household spends $123 dollars a week and $532 per month on groceries.
For further analysis, we broke down the data in the following ways:
Grocery Store | Grocery Store Shopping | Economy | Trends and Predictions
General Food Retail Industry Statistics
The food retail industry, generating over $1.2 trillion in sales, is undoubtedly a vital part of American life. Weekly or monthly trips to grocery stores are commonplace. Here are the key insights:
-
In 2025, the annual sales for the food retail industry reached an estimated $1.2 trillion.
About 85% of that figure is attributed to supermarkets, which form the backbone of the food retail sector.
-
Walmart remains the largest food retail company in the U.S., accounting for about 42% of total industry sales.
In 2025, Walmart generated over $504 billion in sales, maintaining a significant lead in the food retail market with 4,800 stores nationwide.
-
Warehouse clubs generated over $600 billion in 2021.
This includes brands like Costco, Sam’s Club, and BJ’s. As of 2021, 115 million people made annual payments for their Costco membership and 50 million for Sam’s Club.
-
In 2021, 50% of U.S. households shopped online for groceries.
The trend toward online shopping has continued to rise, with many consumers preferring the convenience of home delivery services.
| Retailer | 2025 Sales Revenue (in Billions USD) |
|---|---|
| Walmart | $504B |
| Amazon | $312B |
| Costco | $194B |
| The Kroger Co. | $183B |
| Walgreens Boots Alliance | $136B |
| Target Corp. | $120B |
| CVS Health | $110B |
| Sam’s Club | $82B |
| Albertsons Cos. | $79B |
| Ahold Delhaize | $64B |

Grocery Store Statistics
With over 66,000 grocery stores and supermarkets in the United States, they are a familiar sight in our daily lives. On average, Americans visit the grocery store 1.5 times per week. Here are some insights from our research:
-
The median size of a U.S. grocery store is 43,000 sq. ft.
For perspective, the average size of an American football field is 48,000 sq. ft., indicating that most grocery stores are comparable to stadiums in size.
-
California has the largest number of supermarkets and grocery stores in the U.S., with 12,000 stores.
This is followed by New York with 11,000 stores and Florida with 6,000 stores, reflecting their high populations.
-
Despite generating $800 billion in sales, the average grocery store only makes $15 million in yearly revenue.
The average net profit for grocery stores is about 1.8%, which is relatively low. However, the frequency of grocery shopping across the U.S. helps sustain the industry.
-
As of 2022, the average grocery store carries 42,000 items.
This marks a slight decrease from previous years, indicating shifts in consumer demand and inventory management.
-
The average sale per customer transaction is $40.20.
Despite this modest amount, the average supermarket generates $600,000 in sales per week.
-
The average profit margin in U.S. grocery stores remains at around 1.8%
This translates to about 1.8 cents per grocery item sold. Although grocery stores achieved over $800 billion in sales, the average store reports only $15 million in yearly revenue.
-
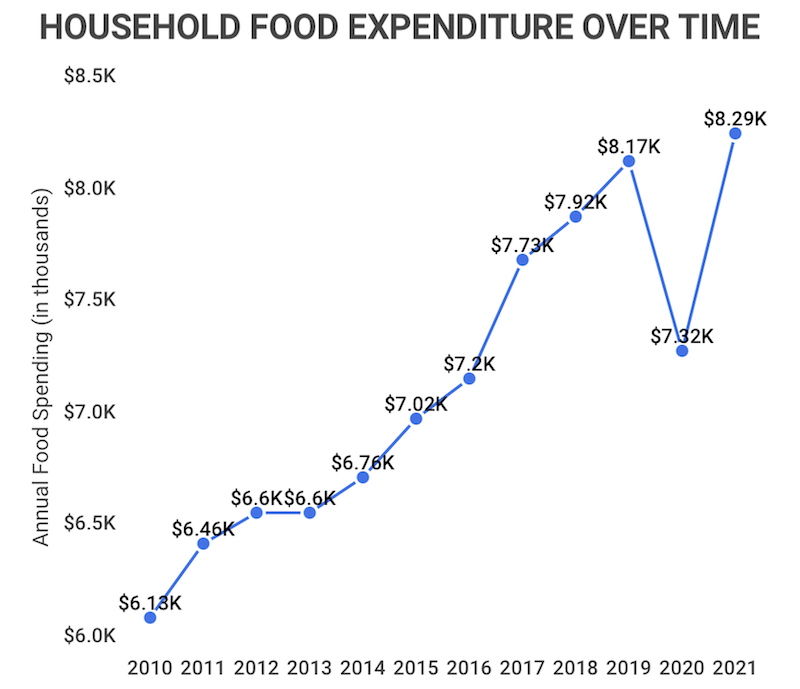
The average American household now spends $6,300 annually on groceries as of 2025.
This translates to approximately $525 a month, reflecting inflation and changing consumer preferences.
-
The average American shopper makes 1.5 grocery trips per week as of 2022.
This number has slightly decreased from previous years, indicating shifts in shopping behavior.
-
The global food retail industry is valued at $12 trillion.
Expert forecasts predict continued growth in the coming years, with a compound annual growth rate (CAGR) of 3.5% from 2022 to 2030.
-
In the United States, grocery stores contribute to 16% of total retail industry sales.
In 2021, grocery stores achieved $800 billion in sales, while the overall retail sector reached $5 trillion. This substantial contribution underscores the importance of grocery retail within the broader economy.
-
Compared to other nations, the United States commands a 45% share of revenues from the 250 largest global companies.
Furthermore, about 30% of the largest companies originate from the U.S., with 75 of the top 250 companies being American.
-
As of 2025, the U.S. food retail industry employs approximately 3 million workers.
Despite this sizable workforce, the sector faces challenges like high turnover rates and limited job growth. The majority of food retail employees are aged 16-24, often changing jobs for better opportunities.
-
The U.S. food retail industry saw an annual sales growth of 2.5% from 2010-2022.
In contrast, the previous decade (2000-2009) recorded an average decline of -0.15% per year. This positive trend is expected to continue into the next decade.
-
From 2022 to 2030, experts project a CAGR of 3.5% for the food retail industry.
This growth is largely driven by the rising trend of online shopping and increasing interest in home cooking.
-
Online grocery sales have continued to rise, reaching $110 billion in 2022.
As a result, online grocery sales now comprise 10% of all grocery sales and capture a growing share of total U.S. e-commerce transactions.
-
As of 2025, 52% of Americans report that they are preparing more meals at home.
This shift aligns with a preference for dining in, as 60% of grocery shoppers indicate they are eating at home more frequently.
-
Where is the food retail industry headed over the next decade?
Over the next decade, the food retail industry is projected to experience a steady 3.5% CAGR. Notably, online grocery sales have surged, with many consumers continuing to prefer the convenience of digital shopping.
-
Should I take a job within the food retail industry?
Choosing to work in the food retail industry is a personal decision, influenced by several factors. The industry employs around 3 million workers, primarily part-time young employees. While turnover rates are high, there has been an uptick in compensation due to the growing need for essential workers.
-
How big is the U.S. food retail industry?
The U.S. food retail industry is substantial, with sales reaching $1.2 trillion in 2025. There are about 66,500 supermarkets and grocery stores across the country, ensuring broad access to food for Americans.
-
What percentage of food retail are groceries?
Grocery store sales account for 92% of all food retail store sales. Convenience and specialty stores make up the remaining 8%, highlighting the dominance of grocery sales in the food retail sector.
-
Is the food retail industry growing?
Yes, the food retail industry is experiencing growth. The sector is forecasted to maintain a robust 3.5% CAGR over the next decade, with significant contributions from major retailers like Walmart and Amazon.
-
What is the largest food retailer in the U.S.?
Walmart is the leading food retailer in the U.S. With $504 billion in annual sales, Walmart commands a substantial portion of the market, significantly outperforming its closest competitor, Amazon, which reports $312 billion in sales.
-
What percentage of Americans use grocery delivery?
38% of Americans have utilized grocery delivery services. Approximately 50 million people are engaged in this growing trend, further accelerated by the pandemic.
-
Statista. “U.S. food retail industry – statistics & facts.” Accessed on March 6, 2026.
-
Statista. “Warehouse clubs in the United States – statistics & facts.” Accessed on August 25, 2025.
-
FMI. “Median Total Store Size – Square Feet.” Accessed on August 25, 2025.
-
ScrapeHero. “The Largest Grocery Chains in the US – Location Analysis.” Accessed on August 25, 2025.
-
CHRON. “The Industry Standard for Gross Margin in Groceries.” Accessed on August 25, 2025.
-
FMI. “Supermarket Facts.” Accessed on August 25, 2025.
-
Grand View Research. “Global Food Grocery Retail Market Size Report, 2022-2030.” Accessed on March 6, 2026.
-
Deloitte. “Global Powers of Retailing 2021.” Accessed on August 26, 2025.
-
USDA. “Retail Trends.” Accessed on August 26, 2025.
-
Insider Intelligence. “In 2021, online grocery sales surpassed $110 billion.” Accessed on August 26, 2025.
-
Winsight Grocery Business. “3 Big Trends From FMI’s 2021 Grocery Shopper Report.” Accessed on August 26, 2025.
-
Nerdwallet. “How Much Should I Spend on Groceries?” Accessed on August 26, 2025.
-
Statista. “Consumers’ weekly grocery shopping trips in the United States from 2006 to 2022.” Accessed on March 6, 2026.
-
Statista. “Annual sales of retail food and beverage stores in the United States from 1992 to 2021.” Accessed on March 6, 2026.
-
Statista. “Supermarket and other grocery store sales in the United States from 1992 to 2021.” Accessed on March 6, 2026.
-
Statista. “Number of Walmart stores worldwide from fiscal year 2006 to 2022, by division.” Accessed on March 6, 2026.
-
Statista. “Walmart’s net sales worldwide from fiscal year 2008 to 2022, by division.” Accessed on March 6, 2026.
-
Statista. “Total retail and food services sales in the United States from 1992 to 2021.” Accessed on March 6, 2026.
-
IBIS World. “Supermarkets & Grocery Stores in the US – Number of Businesses 2002–2028.” Accessed on March 6, 2026.
-
Go Banking Rates. “Average Cost of Groceries per Month: How Much Should You Be Spending?” Accessed on March 6, 2026.
-
Statista. “Average annual household food expenditure in the United States from 2000 to 2021.” Accessed on March 6, 2026.
-
Progressive Grocer. “The PG 100: Ranking Top Food Retailers in North America.” Accessed on March 6, 2026.
Number of U.S. Store Locations by Food Retailer
| Chain | 2025 Number of U.S. Stores |
|---|---|
| Walmart | 4,800 |
| The Kroger Co. | 3,300 |
| Publix | 1,400 |
| Food Lion | 1,200 |
| Save A Lot | 1,000 |
| Safeway Inc. | 800 |
| IGA | 750 |
| Southeastern Grocers | 600 |
| Trader Joe’s | 600 |
| Albertsons Cos. | 590 |
Grocery Store Shopping Statistics
Delving deeper into grocery shopping, here are some noteworthy statistics:
Food Retail Industry and the Economy Statistics
As a significant sector, the food retail industry plays a crucial role in the U.S. economy. Here are some key findings:
Food Retail Industry Trends and Predictions
The U.S. food retail industry is vast and influential, but where is it headed? Here are some key trends:
US Food Retail Industry Statistics FAQ
Conclusion
The U.S. food retail industry is a vital sector that countless Americans depend on. With the average American making 1.5 trips to the grocery store each week and spending about $123 weekly, it’s evident why the industry is projected to grow at a CAGR of 3.5% from 2022 to 2030.
As consumer preferences shift, particularly toward online shopping, the food retail sector is evolving. The increase in grocery delivery services and the trend of cooking at home are expected to shape the industry in the coming years.
Overall, major players like Walmart are well-positioned to thrive and adapt as the landscape continues to change.
References
- Industry Statistics
- Wedding Industry Statistics
- Yoga Industry Statistics
- Music Industry Statistics
- Landscaping Industry Statistics
- Bicycle Industry Statistics
- Coffee Industry Statistics
- Car Rental Industry Statistics
- Home Improvement Industry Statistics
- Insurance Industry Statistics
- Supplements Industry Statistics
- Golf Industry Statistics
- Fitness Industry Statistics
- US Media And Entertainment Industry Statistics
- Firearm Industry Statistics
- Financial Services Industry Statistics
- Health And Wellness Industry Statistics
- Trucking Industry Statistics
- Wine Industry Statistics
- Pet Industry Statistics
- Mobile App Industry Statistics
- Digital Marketing Industry Statistics
- Hotel Industry Statistics
- Retail Statistics
- Robotics Industry Statistics
- Jewelry Industry Statistics
- Appointment Scheduling statistics
- Restaurant Industry Statistics
- Food Delivery Statistics
- Food Truck Industry
- Fashion Industry
- Real Estate Industry
- US Film Industry
- US Beverage Industry
- USu202fFast Food Restaurants
- US Construction Industry
- US Book Industry
- Cosmetics Industry
- US Food Retail Industry
- US Pharmaceutical Industry
- US Healthcare Industry
- Airline Industry
- Automobile Industry
- Transportation Industry Statistics
- Event Industry Statistics
- Project Management Statistics
- Oil And Gas Industry Statistics
- Nursing Home Statistics
- Nursing Shortage Statistics
- Nursing Statistics
Author
Chris Kolmar is a co-founder of Zippia and the editor-in-chief of the Zippia career advice blog. He has hired over 50 people in his career, been hired five times, and wants to help you land your next job. His research has been featured on the New York Times, Thrillist, VOX, The Atlantic, and a host of local news. More recently, he's been quoted on USA Today, BusinessInsider, and CNBC.