Find a Job You Really Want In
If you’re eager to tie the knot and find yourself attending numerous weddings — yet still waiting for your own — you might want to consider how your college major plays a role. Our research at Zippia suggests that the choice of major can significantly influence your marriage prospects.
According to recent analysis of Census data, your college major is a key predictor of when you’ll marry, even when controlling for factors like income and gender, which are also correlated with marriage age.
If getting married sooner is your goal, aside from finding the right partner, consider majoring in education, boosting your income, and being a woman, as these factors have shown strong correlations with marriage rates.
For those who are simply curious about when they might be getting married, we’ve included a complete alphabetical list at the bottom of this article.
The 30-Year Marriage Benchmark
Have you noticed that popular culture often suggests you should be married by age thirty? Current U.S. Census data reflects that the median age for men to marry is around 30, while for women it is about 28.
Despite the arbitrary nature of this societal expectation, we utilized census data from the 2017-2021 ACS to identify trends. Our criteria for analysis included:
- Holding a college degree
- Being thirty years old
- Having at least ten occurrences of the major for both genders
Our analysis revealed some intriguing trends about the relationship between college majors and marriage at age thirty.
1. Your Marital Status is Correlated to Your Major
Certain majors show a strong tendency towards marriage, particularly those in education and religious vocations.
Research indicates that individuals are more likely to marry someone who shares their major than anyone else. Furthermore, your likelihood of being married is closely linked to your field of study.
Our analysis controlled for income and gender variations and established a significant correlation between your chosen major and your marriage rate.

Could it be that the personality traits and values leading you to select a particular major also influence your major life choices? Likely.
Does your major affect your career path, which in turn connects you with others who share similar values? That’s plausible as well, but our focus remains solely on the link between your major and marital status.
2. Women are More Likely to be Married at Thirty
Perhaps it’s the influence of romantic comedies, but women are statistically more likely to be married by age thirty.
In fact, they are almost ten percent more likely to be married compared to their male counterparts.
The Most Married Major and Gender Combinations at Thirty

With the notable exception of male Plant Sciences Majors, the top ten most-married major and gender combinations are predominantly female.
If you’re questioning how women can be married more often than men, consider that this analysis includes only college graduates aged 30. Many of these women may be marrying men without degrees or those from different age brackets.
This scenario is further supported by the fact that the median marriage age for women is slightly lower than for men, with both genders achieving similar bachelor’s degree attainment rates — 33% for women and 32% for men.
3. More Money Equals More Marriage
Simply put, higher income correlates with a greater likelihood of being married.
Since income is closely related to your major, we ensured our analysis accounted for this variable. We found that your probability of being married at thirty is indeed directly linked to your income.
The inverse is also true: not only does increased income enhance your chances of marriage, but being married generally correlates with higher income levels.
This challenges common perceptions that marriage simplifies financial management.
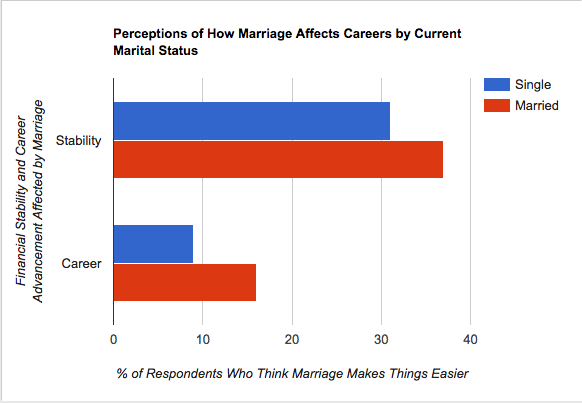
A Pew Research study shows that both married and single individuals believe that remaining single allows for easier career advancement — 22% of married and 32% of singles hold this belief.
In reality, this perception is misguided.
10 Majors Most Likely to be Married at 30
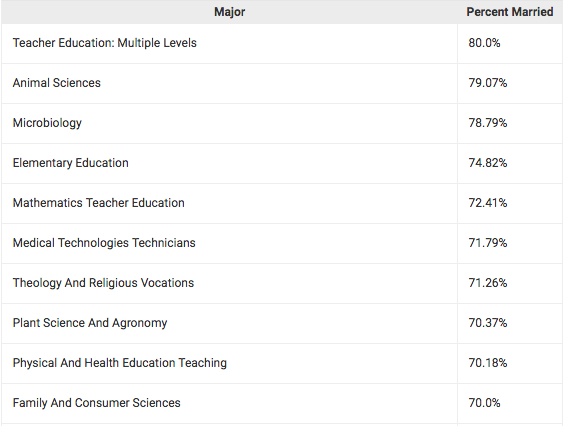
While Theology and Religious Vocations topped the list for those aged 25, by age 30, education majors are more prevalent among the married. Animal Sciences majors also make a surprising leap into the top ranks, alongside Microbiology and Plant Science majors — perhaps their studies about life inspire them to create one of their own.
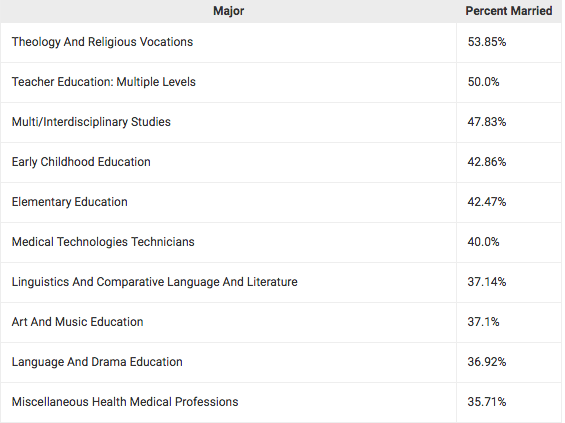
10 Majors Least Likely to be Married at 30

Geography Majors seem too focused on distant lands to consider walking down the aisle. Meanwhile, Drama students continue to chase their dreams without necessarily settling down.
It’s worth noting that students in Film and Photographic Arts have one of the highest unemployment rates (12.9%) in the current labor market, while Fine Arts majors follow closely at 12.6%, which likely impacts their marriage prospects as well.
Our Overall Findings in a Nuptial Nutshell
Our findings indicate that specific majors, especially those with a higher proportion of female graduates, are linked with earlier marriages. Therefore, if you want to be married by thirty:
- Boost your income
- Consider studying education
- Identify as a woman
While it may be challenging to earn a high salary as a teacher, Education Majors are predominantly female, which skews the statistics in their favor.
If you prefer to remain single, consider majoring in Mass Communications, which shows the lowest marriage rates for both genders — 41% for women and men alike.
And while it’s not advisable to neglect personal hygiene or job hunting, those who do may find it easier to avoid marriage altogether.
A List of the Marriage Rates for All Majors at Thirty
| Major | Percent Married |
|---|---|
| Accounting | 61.13% |
| Advertising And Public Relations | 65.88% |
| Aerospace Engineering | 62.96% |
| Agriculture Production And Management | 63.64% |
| Animal Sciences | 79.07% |
| Anthropology And Archeology | 49.25% |
| Architecture | 47.52% |
| Area Ethnic And Civilization Studies | 50.0% |
| Art And Music Education | 58.21% |
| Art History And Criticism | 53.57% |
| Biochemical Sciences | 50.0% |
| Biology | 56.32% |
| Biomedical Engineering | 52.0% |
| Business Economics | 61.54% |
| Business Management And Administration | 58.75% |
| Chemical Engineering | 58.73% |
| Chemistry | 59.65% |
| Civil Engineering | 60.38% |
| Commercial Art And Graphic Design | 53.68% |
| Communication Disorders Sciences And Services | 69.23% |
| Communication Technologies | 46.15% |
| Communications | 55.43% |
| Community And Public Health | 65.71% |
| Composition And Rhetoric | 56.0% |
| Computer Administration Management And Security | 65.38% |
| Computer And Information Systems | 68.7% |
| Computer Engineering | 56.9% |
| Computer Science | 53.27% |
| Construction Services | 62.16% |
| Criminal Justice And Fire Protection | 53.72% |
| Criminology | 51.35% |
| Drama And Theater Arts | 42.11% |
| Early Childhood Education | 69.44% |
| Ecology | 50.0% |
| Economics | 49.17% |
| Electrical Engineering | 63.56% |
| Electrical Engineering Technology | 60.71% |
| Elementary Education | 74.82% |
| English Language And Literature | 52.49% |
| Environmental Science | 52.08% |
| Family And Consumer Sciences | 70.0% |
| Film Video And Photographic Arts | 48.44% |
| Finance | 50.0% |
| Fine Arts | 50.0% |
| French German Latin And Other Common Foreign Language Studies | 53.68% |
| General Agriculture | 56.52% |
| General Business | 58.13% |
| General Education | 61.74% |
| General Engineering | 56.12% |
| General Medical And Health Services | 60.29% |
| General Social Sciences | 35.9% |
| Geography | 32.43% |
| Geology And Earth Science | 44.0% |
| Health And Medical Administrative Services | 52.78% |
| Health And Medical Preparatory Programs | 54.55% |
| History | 54.3% |
| Hospitality Management | 63.79% |
| Human Resources And Personnel Management | 54.69% |
| Human Services And Community Organization | 58.06% |
| Industrial And Manufacturing Engineering | 51.22% |
| Information Sciences | 54.05% |
| Intercultural And International Studies | 53.33% |
| International Business | 47.73% |
| International Relations | 41.03% |
| Journalism | 57.25% |
| Language And Drama Education | 66.67% |
| Liberal Arts | 54.05% |
| Linguistics And Comparative Language And Literature | 66.67% |
| Management Information Systems And Statistics | 57.78% |
| Marketing And Marketing Research | 57.77% |
| Mass Media | 41.03% |
| Mathematics | 58.64% |
| Mathematics Teacher Education | 72.41% |
| Mechanical Engineering | 58.96% |
| Medical Assisting Services | 52.17% |
| Medical Technologies Technicians | 71.79% |
| Microbiology | 78.79% |
| Miscellaneous Biology | 66.67% |
| Miscellaneous Business And Medical Administration | 67.65% |
| Miscellaneous Education | 70.0% |
| Miscellaneous Engineering | 52.38% |
| Miscellaneous Health Medical Professions | 58.62% |
| Molecular Biology | 53.06% |
| Multi-Disciplinary Or General Science | 50.94% |
| Multi/Interdisciplinary Studies | 52.0% |
| Music | 44.72% |
| Natural Resources Management | 50.0% |
| Neuroscience | 47.83% |
| Nursing | 63.65% |
| Nutrition Sciences | 56.25% |
| Operations Logistics And E-Commerce | 52.17% |
| Pharmacy Pharmaceutical Sciences And Administration | 40.82% |
| Philosophy And Religious Studies | 46.83% |
| Physical And Health Education Teaching | 70.18% |
| Physical Fitness Parks Recreation And Leisure | 64.89% |
| Physics | 57.14% |
| Physiology | 52.0% |
| Plant Science And Agronomy | 70.37% |
| Political Science And Government | 49.48% |
| Pre-Law And Legal Studies | 61.9% |
| Psychology | 51.96% |
| Secondary Teacher Education | 64.44% |
| Social Science Or History Teacher Education | 65.91% |
| Social Work | 58.41% |
| Sociology | 50.86% |
| Special Needs Education | 68.12% |
| Studio Arts | 58.14% |
| Teacher Education: Multiple Levels | 80.0% |
| Theology And Religious Vocations | 71.26% |
| Transportation Sciences And Technologies | 64.71% |
| Treatment Therapy Professions | 63.64% |
And for Further Reading: Our Top Ten and Bottom Ten Ranking by Age Snapshots
We charted the data to show your likelihood of being married at ages 25, 30, and 35 based solely on your major.
This analysis focuses strictly on current marital status — not on previous marriages or those who may be remarrying.
10 Majors Most Likely to be Married at 25
The conclusion here is clear: majors associated with strong ethical values tend to lead to quicker marriages, particularly for education-oriented fields.
10 Majors Least Likely to be Married at 25

The lower marriage rates for these majors could be attributed to a higher percentage of graduates pursuing advanced degrees, or in the case of Drama and Theater Arts, following their artistic passions.
10 Majors Most Likely to be Married at 35
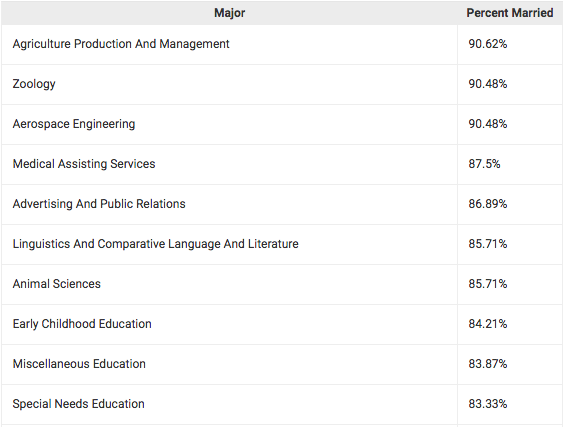
Agricultural Production and Management has emerged as the leader, closely followed by Zoology, which is fascinating as it did not appear on previous lists.
10 Majors Least Likely to be Married at 35

Author
David Luther was the Content Marketing Editor for the Zippia Advice blog. He developed partnerships with external reporting agencies in addition to generating original research and reporting for the Zippia Career Advice blog. David obtained his BA from UNC Chapel Hill.