- Facts and Figures
- Social Security Statistics
- Social Media Statistics
- Cell Phone Usage Statistics
- Cryptocurrency Statistics
- White Collar Crime Statistics
- Crowdfunding Statistics
- Branding Statistics
- How Many Emails Are Sent Per Day
- Money Laundering Statistics
- Childcare Availability Statistics
- Cold Calling Statistics
- Automation And Job Loss Statistics
- Student Loan Statistics
- Spam Statistics
- Password Statistics
- Ransomware Statistics
- Christmas Spending Statistics
- Average Grocery Cost By State
- Average Screen Time Statistics
- Average Monthly Expenses
- IoT Statistics
- Gen Z Statistics
Research Summary: Curious about how your monthly expenses measure up against those of other Americans in 2026? While many of our average monthly expenditures are commonplace and unavoidable, you may be surprised by the numbers. To provide insights into average household monthly expenses in the U.S., we have compiled the latest statistics. Based on our thorough research:
-
Average monthly personal expenses in the U.S. are $3,870.
-
Average monthly household expenses in the U.S. are $6,250.
-
The primary category of spending for U.S. households is housing, with the average cost being $2,000, accounting for over 32% (one-third) of total spending.
-
Approximately 80% of American incomes are allocated to living expenses.
For a deeper understanding, we have categorized the data as follows:
Average Spending | Monthly Spending | Income and Spending | Other Spending
Average Spending Statistics
Average monthly spending and annual spending are closely related, with costs accumulating over time. Here are some key statistics regarding typical spending:
-
The average annual spending for American households is $78,000.
This accounts for approximately 76% of the average yearly income of $102,000, leaving the average American household with about $24,000 of their total income each year.
-
The average monthly household expenses for a family of four are $8,500.
Families of four have the highest average monthly household expenses, surpassing those of families with five or more members, who average $8,000.
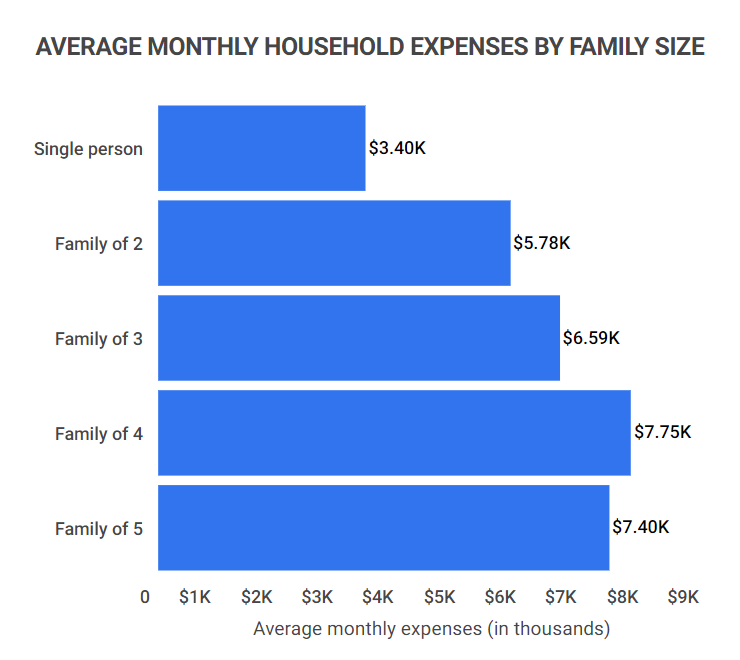
Average Monthly Household Expenses By Family Size
Family size Average monthly expenses Average annual expenses Single person $3,870 $46,440 Family of 2 $6,250 $75,000 Family of 3 $7,000 $84,000 Family of 4 $8,500 $102,000 Family of 5 $8,000 $96,000 -
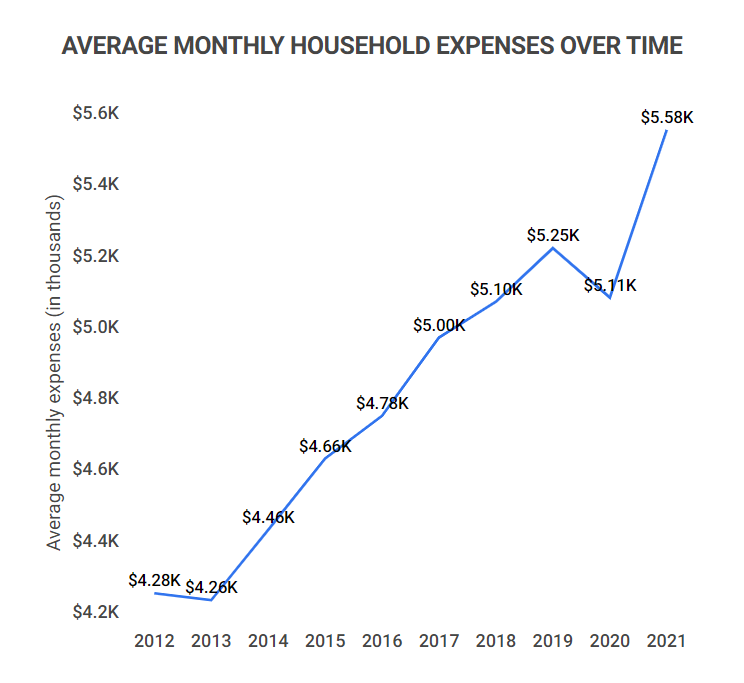
Average monthly expenses in the U.S. have risen by over 40% from 2012 to 2026.
In 2012, average monthly expenses were about $4,700 per month ($56,400 annually). As of 2026, this average has escalated to $6,250 per month ($78,000 annually).
Average Monthly Household Expenses Over Time
Year Average monthly expenses Average annual expenses 2012 $4,700 $56,400 2013 $4,600 $55,200 2014 $4,800 $57,600 2015 $5,000 $60,000 2016 $5,200 $62,400 2017 $5,500 $66,000 2018 $5,600 $67,200 2019 $5,850 $70,200 2020 $5,500 $66,000 2021 $5,700 $68,400 2022 $6,000 $72,000 2023 $6,150 $73,800 2024 $6,250 $75,000 2025 $6,400 $76,800 2026 $6,250 $78,000 -
Average monthly spending surged by 8% between 2021 and 2022.
After a period of restraint during the pandemic, Americans have resumed increasing their spending year over year.
-
The categories with the most significant spending increases between 2021 and 2022 were Entertainment and Apparel and Services (both +25%).
Spending in these categories jumped by 25% year-over-year, reflecting a growing interest in leisure and fashion following pandemic restrictions.
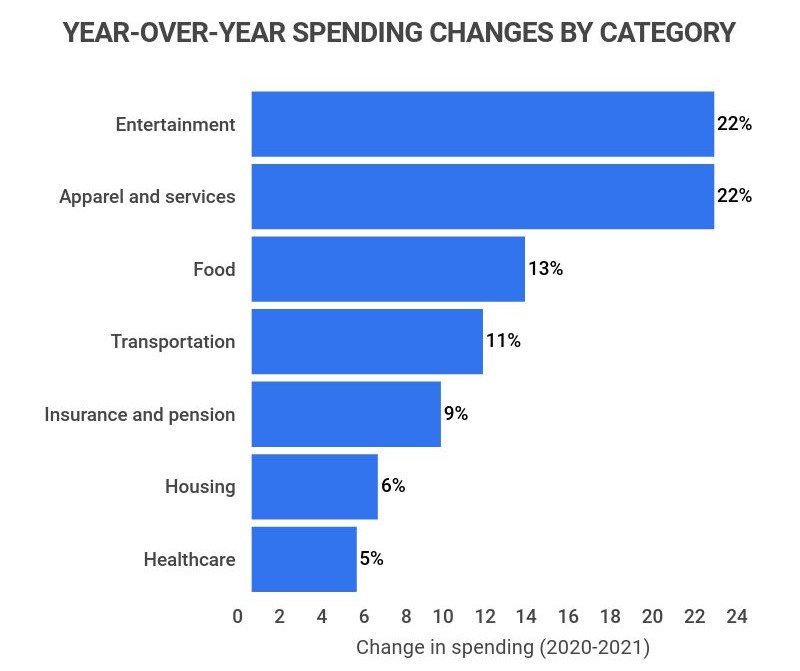
Year Over Year Spending Changes By Category
Category Year-over-year change in spending (2021-2022) Entertainment 25% Apparel and services 25% Food 15% Transportation 12% Insurance and pension 10% Housing 8% Healthcare 6%
Monthly Spending by Category
American spending habits can vary widely based on individual circumstances. For instance, someone with substantial student loans may face higher expenses than someone without. Here are some notable statistics on average monthly spending by category:
-
Housing represents the largest share of monthly American income, at over 32%.
Americans dedicate a significant portion of their monthly income to housing, while transportation, the second-largest expense, accounts for less than half that amount.
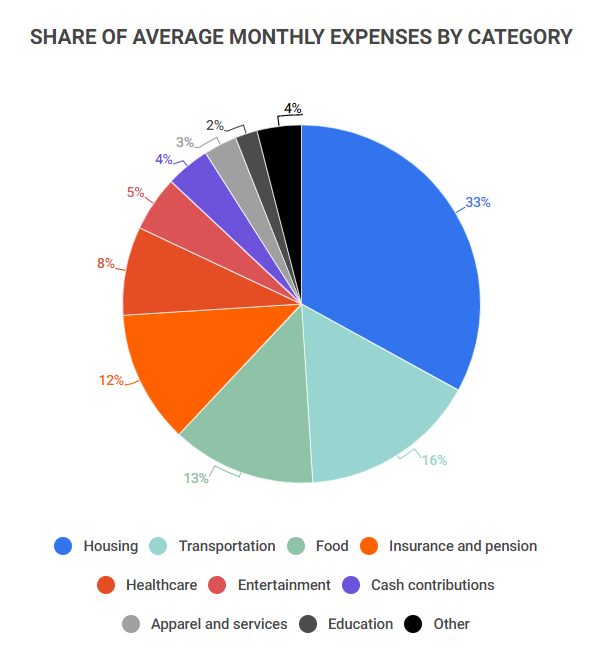
Share Of Average Monthly Expenses By Category
Category Share of monthly expenses Average monthly expense Housing 32% $2,000 Transportation 15% $940 Food 12% $750 Insurance and pension 11% $685 Healthcare 9% $542 Entertainment 6% $375 Cash contributions 4% $250 Apparel and services 3% $190 Education 2% $125 Misc. 1% $90 Personal care 1% $75 Alcoholic beverages <1% $60 Tobacco/smoking products <1% $40 Reading <1% $15 -
On average, Americans spend $1,400 per month on debt.
Debt can significantly impact monthly expenses for Americans, particularly those with mortgages, auto loans, or student loans.
Average Monthly Debt By Category
Type of debt Average monthly payment Mortgage Payments $1,250 Car Payments $530 Personal Loan Payments $490 Student Loan Payment $350 Credit Card Payments $300 Other Debts $280
Income and Spending Statistics
Americans allocate a significant portion of their income to various monthly expenses, with disparities among categories. Here are some statistics illustrating the income-to-spending relationship in the U.S.:
-
Of the 80% of income spent on expenses, 30% goes toward Housing.
Meanwhile, 15% is allocated to transportation, and 12% to food, making these the most impactful expenses on an individual’s income.
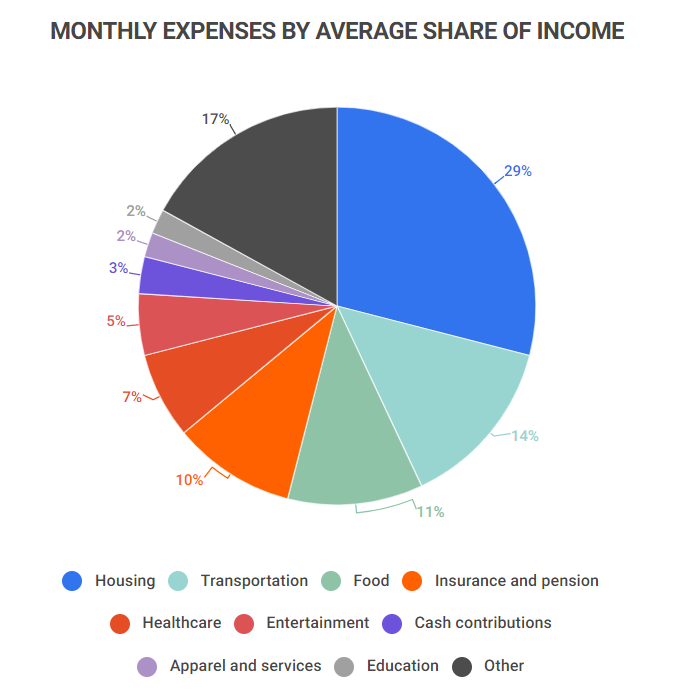
Monthly Expenses By Average Share Of Income
Category Percent of total income Housing 30% Transportation 15% Food 12% Insurance and pension 9% Healthcare 8% Entertainment 6% Cash contributions 4% Apparel and services 2% Education 2% Misc. 1% Personal care 1% Alcoholic beverages 1% Tobacco/smoking products <1% Reading <1% -
The average individual spends 58% of their monthly income on expenses.
The average monthly personal income for Americans is $6,700, with the average personal expense being $3,870 per month. Thus, individuals often incur less of their income in expenses compared to families and households.
-
The average American household spends 84% of its income on expenses.
Despite higher income levels, American households face more expenses than the average individual due to a greater likelihood of having mortgages and other debts.
-
The average household allocates 18% of its income to mortgage payments.
Mortgage payments alone cost the average person $1,250, making it a significant factor in the overall cost of housing. Other housing-related expenses include:
Average Monthly Housing Expenses
Expense Percent of total income Average monthly expense Mortgage payment 18% $1,250 Utilities/fuels/public services 6% $400 Furniture/appliances 4% $250 Household operations 3% $180 Housekeeping supplies/laundry 1% $90 -
The average household spends 7% of their income on vehicle purchases.
Debt remains a major contributor to monthly expenses, particularly in terms of auto payments. Other transportation costs include:
Average Monthly Transportation Expenses
Expense Percent of total income Average monthly expense Vehicle purchases 7% $470 Gas and oil 4% $240 Insurance 2% $150 Maintenance/repairs 1% $100 Rental/leases/fees 1% $75 Public transportation 1% $50 Vehicle finance charges <1% $30 -
The average household allocates 6% of their income to health insurance.
While healthcare costs may be minimal or covered by the government in many developed countries, the U.S. has notably high healthcare expenses. It’s crucial to factor these costs into your budget:
Average Monthly Healthcare Expenses
Expense Percent of total income Average monthly expense Health insurance 6% $409 Medical services 1% $100 Prescription drugs 1% $50 Medical supplies <1% $20 -
The average American spends 10.5% of their income on debt.
This figure may seem low, but it reflects the diverse financial situations of Americans across the country.
Other Spending Categories
Americans have significant monthly expenditures, some of which are essential while others are discretionary. Here are additional facts about spending habits:
-
Americans spend an average of $60 per month on alcoholic beverages.
When combined with the $40 spent on tobacco and smoking products, spending on these items surpasses personal care expenditures ($75).
-
Americans spend an average of $650 per month on home and vehicle fuels.
Specifically, utilities and fuel for housing cost around $400 monthly, while filling a vehicle’s gas tank averages about $240 monthly.
-
Americans spend about $75 per month on their pets.
This expense can quickly add up, especially with costs such as food and grooming.
-
Clothing and associated costs average $190 in monthly expenses.
Given that clothing prices have surged recently, budgeting for these costs is essential.
Monthly Expenses FAQ
-
How much are monthly living expenses for a single person?
Monthly expenses for a single person in the U.S. are around $3,870. This totals approximately $46,440, significantly lower than expenses for households with two or more people.
On average, individuals dedicate less of their income to expenses compared to larger households, spending 58% of their total income, while households can spend up to 84%.
-
What is a reasonable monthly budget?
A realistic monthly budget typically follows the 50-30-20 rule. This guideline suggests allocating 50% of your income to needs, 30% to wants, and 20% to savings.
Implementing this plan could position you well ahead of the average American, as only 16% manage to save more than 15% of their annual income. For instance, if you earn $60,000 yearly, you could potentially save $12,000.
This approach also helps manage expenses, allowing you to evaluate if you’re overspending and need to adjust your budget.
-
What are the average monthly expenses for a family of four in the U.S.?
The average monthly expense for a family of four in the U.S. is $8,500. This amount totals $102,000 annually, making it the highest among all family sizes. In comparison, families with five members spend around $8,000 monthly, or 6% less than a family of four. Similarly, a family of three spends around 12% less than a family of four.
-
What do Americans spend the most money on?
Americans allocate the largest portion of their budget to housing. Housing expenses constitute 32% of all expenditures and 30% of household income. The average housing expense is $2,000, with mortgage payments averaging $1,250. The cost of housing dwarfs that of the next largest category, Transportation.
These costs are likely to continue rising as housing prices and interest rates remain elevated.
Conclusion
American households spend an average of $6,250 per month on everyday expenses, which constitutes around 80% of their average income.
While income is directed towards various expenditures, the three largest categories are Housing, Transportation, and Food, making up 30%, 15%, and 12% of household income, respectively. Mortgage payments alone average $1,250 per month.
This highlights the significant impact of debt on expenses, as Americans allocate a substantial portion of their income to housing, auto, and student loan payments.
If you have concerns about your expenses, it’s crucial to assess them closely. This analysis can inform a more effective budgeting strategy.
References
-
BLS – Consumer expenditures in 2022
-
BLS – Consumer Expenditure Surveys
-
First Republic Bank – A Look at the Average American’s Monthly Expenses
-
Bankrate – What Americans spend: A look at the cost of housing, food, transportation and more
-
Lendingtree – Average Monthly Debt Payments Throughout the U.S.
- Facts and Figures
- Social Security Statistics
- Social Media Statistics
- Cell Phone Usage Statistics
- Cryptocurrency Statistics
- White Collar Crime Statistics
- Crowdfunding Statistics
- Branding Statistics
- How Many Emails Are Sent Per Day
- Money Laundering Statistics
- Childcare Availability Statistics
- Cold Calling Statistics
- Automation And Job Loss Statistics
- Student Loan Statistics
- Spam Statistics
- Password Statistics
- Ransomware Statistics
- Christmas Spending Statistics
- Average Grocery Cost By State
- Average Screen Time Statistics
- Average Monthly Expenses
- IoT Statistics
- Gen Z Statistics
Author
Jack Flynn is a writer for Zippia. In his professional career he’s written over 100 research papers, articles and blog posts. Some of his most popular published works include his writing about economic terms and research into job classifications. Jack received his BS from Hampshire College.