- Small Business Statistics
Research Summary. Business travel remains a crucial element in the operations of companies across the globe, whether for essential meetings, conferences, or networking opportunities. Our updated research highlights the current state of business travel in 2026:
-
In the U.S., business travel generates approximately $387 billion annually, reflecting its significant role in the economy.
-
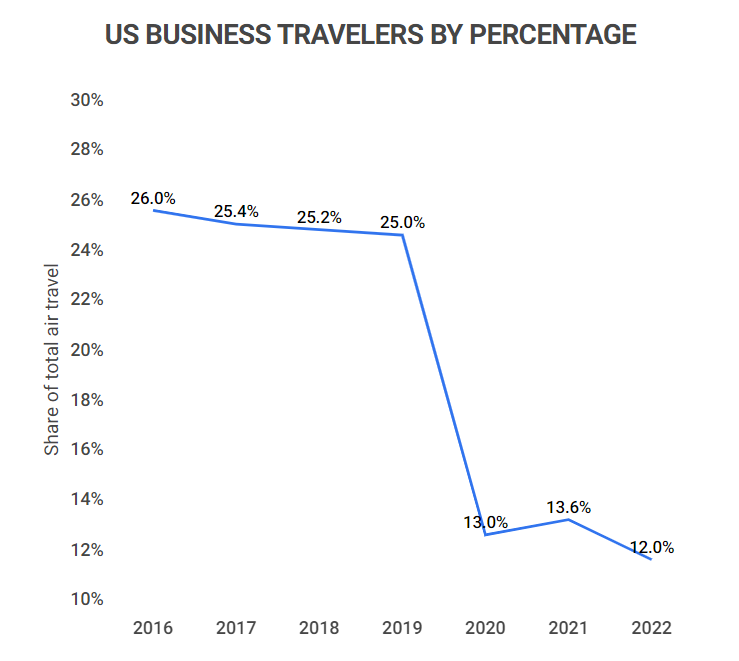
Business trips constitute about 12% of total U.S. air travel while contributing up to 75% of airline profits.
-
Approximately 35% of U.S. businesses engage in business travel activities.
-
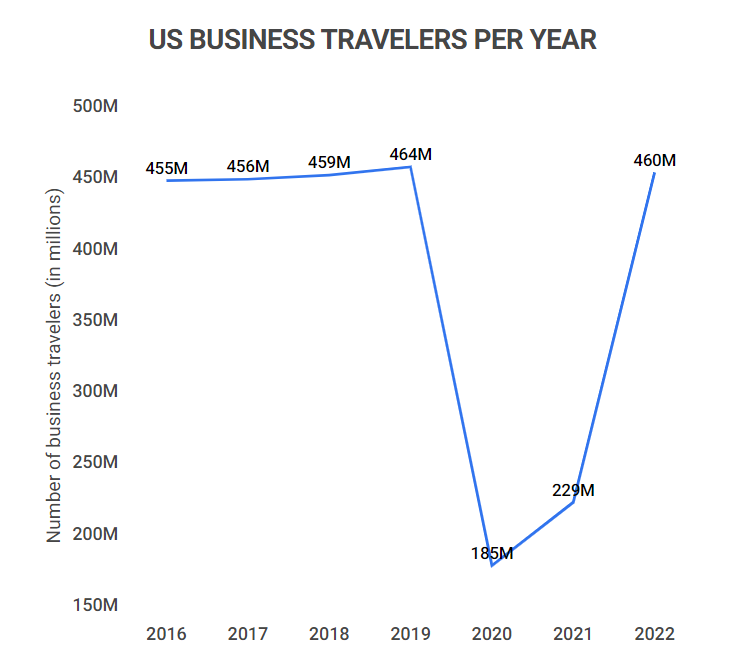
From 2019 to 2020, business trips in the U.S. plummeted from 464 million to just 185 million, a decline that signified the impact of global events.
-
On average, a business trip costs Americans about $949 in travel expenses.
For further insights, we have organized the data into the following categories:
Trip | Spending | Traveler | Company Policy | Trends and Projections
General Business Travel Statistics
Business travel’s vital contribution to air travel revenue underscores its importance in the U.S. economy. Here are the latest insights:
-
In 2016, business travel contributed $547 billion to the U.S. GDP.
This accounted for around 3% of GDP, a figure that remained stable until the disruptions of 2020. Experts predict a 36% reduction in business travel post-pandemic, a trend that continues to influence corporate travel strategies.
-
By 2022, business travel represented 12% of U.S. air travelers.
The number of business travelers exceeded 460 million, showing a recovery from the sharp decline to 185 million in 2020 but still reflecting the ongoing effects of the pandemic.
-
Business travel can contribute as much as 75% to airline revenues.
Corporations increasingly prioritize comfort for their travelers, opting for premium travel experiences that bolster brand reputation and competitiveness.
-
Business travelers account for around 40% of hotel guests.
Among these travelers, 63% are male, and 50% fall within the 35-54 age bracket, with 56% holding professional or managerial roles earning $127,000 or more.
Business Trip Statistics
Understanding the profile of an average business trip reveals key insights into traveler behavior and company expenditures:
-
The average domestic business trip in the U.S. lasts three days.
For international trips, the average duration is 5-6 days, reflecting a slight decline over the years compared to previous averages.
-
Approximately 26% of business trips are one-day excursions.
While these short trips can drive higher costs due to last-minute bookings, they also help companies save on lodging and food expenses.
-
Meetings and events comprise 38% of U.S. business travel.
This segment, including meetings, events, and incentive travel, constitutes a substantial $139.3 billion of overall business travel spending.
-
Daily, around 1.3 million business trips occur in the U.S.
This figure reflects a recovery trajectory post-pandemic, although not yet reaching pre-COVID levels.
Business Travel Spending Statistics
Despite the costs associated with business travel, companies continue to invest significantly. Here’s a breakdown of expenses:
-
The cost of a typical three-day domestic business trip ranges from $990 to $1,293.
In contrast, international trips average around $2,600 or more, necessitating strong justification for travel.
-
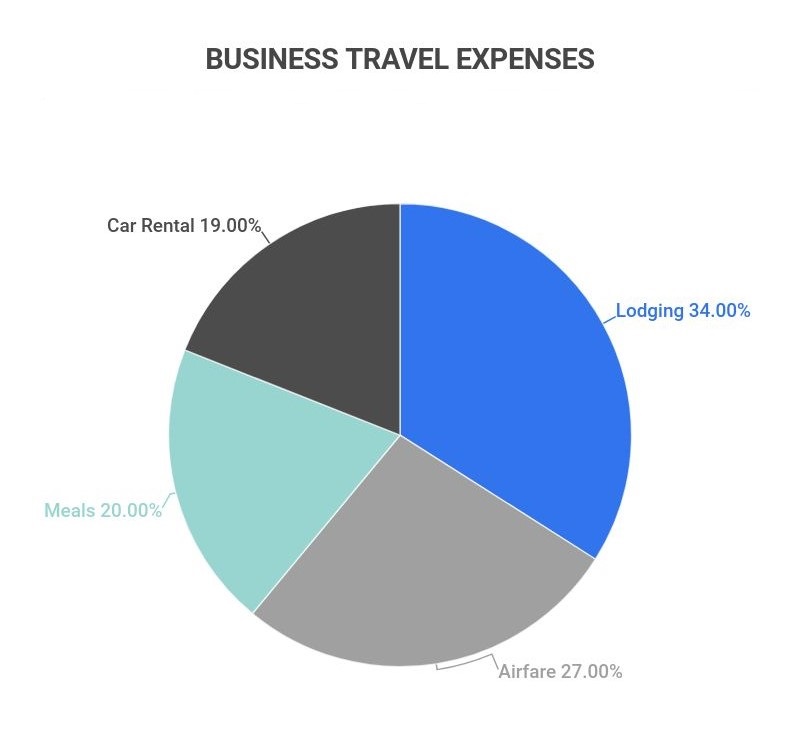
Companies allocate 17-27% of their total travel budget to airfare.
Notably, airfare does not represent the most significant cost in business travel; the average domestic flight costs about $470.
-
Food expenses account for over 20% of a typical business travel budget.
This can quickly accumulate, and utilizing complimentary hotel breakfasts can help mitigate costs.
-
Lodging is the highest expense, constituting approximately 34% of total costs.
Hotels benefit significantly from business travelers, who comprise a large portion of their clientele.
-
On average, companies spend about $799 per person per day during business trips.
With such high daily costs, careful planning is essential to manage travel budgets effectively.
Business Traveler Statistics
The landscape of business travel is shaped by demographics and company policies, influencing who travels and how often:
-
At least 50% of business travelers are aged between 35-54.
This trend reflects the correlation between age and role, as older employees often hold senior positions. Additionally, 56% of business travelers earn at least $127,000 per year.
-
The average business traveler undertakes roughly 6.8 trips per year.
Interestingly, millennials report an average of 7.4 trips annually, indicating a higher travel frequency among younger professionals.
-
47% of female travelers engage in business travel.
While slightly less common than their male counterparts, women tend to report more positive travel experiences compared to men.
-
As of 2021, only 12% of corporate travel representatives believed their employees were unwilling to travel.
Post-pandemic, many employees have become more open to business travel, with 61% expressing increased comfort with travel guidelines.
-
Completing an expense report typically takes an average of 38 minutes.
With an error rate of 19% in submissions and an average of 1.5 reports filed monthly, this can lead to significant time expenditure on administrative tasks.
Business Travel Company Policy Statistics
To manage the financial implications of business travel, companies often establish travel policies. Here are some relevant statistics:
-
72% of corporate travel managers report not achieving their desired compliance with travel policies.
This lack of compliance often stems from issues related to traveler experience, fairness, and transparency.
-
Only 50% of business travelers adhere to their company’s travel policy.
Moreover, 60% of travelers claim they do not fully understand their company’s travel policies, complicating adherence.
-
81% of business travel occurs via personal vehicles.
In contrast, only 16% of travel happens by air, highlighting the preference for ground transportation among business travelers.
-
90.6% of corporate travel managers assert that business travel is essential for business growth.
This is supported by data indicating that companies earn an average of $2.90 in profit for every dollar spent on corporate travel.
Business Travel Trends and Projections
The business travel sector has shown resilience following the challenges posed by the pandemic. Current trends and projections indicate the following:
-
Business travelers in the U.S. decreased from 464 million to just 185 million between 2019 and 2020.
However, numbers started to rise again, reaching approximately 229 million in 2021.
-
From 2010 to 2019, the number of business travelers grew by 4%.
The pandemic drastically reduced this growth, with a 60% drop in business travelers in 2020.
-
The business travel industry anticipates a CAGR of 13.2% from 2021 to 2028.
Recovery is expected, with industry valuation projected to rise from $695.9 billion in 2020 to $2.1 trillion by 2028.
Business Travel FAQ
-
How many people travel for business annually?
In the U.S., over 460 million individuals travel for business each year. This represents a significant rebound from 2020’s low of 185 million, approaching pre-pandemic levels.
-
What types of businesses travel the most?
The following professions consistently travel for business:
-
International Aid Worker
-
Civil Servant
These roles often necessitate travel for business-related purposes. Notably, 56% of business travelers occupy professional or managerial positions with salaries exceeding $127,000 annually.
-
How big is the business travel market?
As of 2022, the business travel market is valued at approximately $933 billion. Following a 14% rebound from 2020 to 2021, the market is projected to sustain a CAGR of 13.2% through 2028.
-
What percent of travel is business travel?
Business travel constituted about 12% of total U.S. travel as of 2022. While this reflects a decline from 2019 levels, it indicates a gradual recovery in travel trends.
-
How much do companies spend on business travel?
U.S. companies invest over $111.7 billion annually in business travel. This typically represents around 10% of a company’s total annual revenue.
Conclusion
Business travel remains a pivotal investment for companies across the United States. Despite average trip costs ranging from $990 to $1,293, organizations continue to prioritize sending employees on business trips, understanding their potential for driving growth and fostering important relationships. Demographically, business travelers tend to be aged 35-54, with a significant percentage holding high-level positions and earning over $127,000 annually.
The pandemic had a profound impact on business travel, with numbers plummeting from 464 million travelers to 185 million. However, industry forecasts suggest a strong recovery, with a projected CAGR of 13.2% from 2021 to 2028, indicating a positive trajectory for the sector.
Sources
-
Global Business Travel. “Business Travel Responsible for $547 Billion in U.S. GDP in 2016, Creates Over 7.4 Million Jobs.” Accessed on December 8th, 2021.
-
Statista. “Number of domestic business and leisure trips in the United States from 2008 to 2019, with a forecast until 2024.” Accessed on December 8th, 2021.
-
Investopedia. “How Much Airline Revenue Comes From Business Travelers?” Accessed on December 8th, 2021.
-
AHLA. “Lodging Industry Trends 2015.” Accessed on December 8th, 2021.
-
Travel Leaders Corporate. “09 Nov Travel Leaders Corporate Releases Q3 Business Travel Trends Data.” Accessed on December 8th, 2021.
-
U.S. Travel Association. “U.S. Travel Answer Sheet.” Accessed on December 8th, 2021.
-
Bureau of Transportation. “U.S. Business Travel.” Accessed on December 8th, 2021.
-
GBTA. “U.S. Business Travel – By The Numbers.” Accessed on December 8th, 2021.
-
TravelBank. “How Much Should a Business Trip Cost?” Accessed on December 8th, 2021.
-
JTB. “Important Business Travel Statistics.” Accessed on December 8th, 2021.
-
Trondent Development Corp. “Business Travel by the Numbers.” Accessed on December 9th, 2021.
-
GTI Travel. “What do Female Business Travelers do Differently from their Male Counterparts.” Accessed on December 9th, 2021.
-
Hotel Management. “GBTA poll finds positive momentum for business travel.” Accessed on December 9th, 2021.
-
SAP Concur. “Save time and money on expense report processing.” Accessed on December 9th, 2021.
-
TravelPerk. “5 reasons why traveler satisfaction is the key to a successful travel program.” Accessed on December 9th, 2021.
-
Cision. “Business Travel Market Size to Reach USD 2,001.1 Billion by 2028 at CAGR 13.2% – Valuates Reports.” Accessed on December 9th, 2021.
-
Certify. “Understanding the average cost of business travel.” Accessed on December 9th, 2021.
- Small Business Statistics
Author
Jack Flynn is a writer for Zippia. In his professional career he’s written over 100 research papers, articles and blog posts. Some of his most popular published works include his writing about economic terms and research into job classifications. Jack received his BS from Hampshire College.