
- Business Statistics
- Startup Statistics
- Cloud Adoption Statistics
- Customer Loyalty Statistics
- Nonprofit Statistics
- Affiliate Marketing Statistics
- Cart Abandonment Rate Statistics
- Ridesharing Statistics
- Call Center Statistics
- eLearning statistics
- Customer Service Statistics
- Customer Experience statistics
- Entrepreneur Statistics
- Outsourcing Statistics
- Gross Revenue for Marketing and Advertising
- Sales Statistics
- MBA Statistics
- Average Small Business Revenue + Profit Margin
- How Much Do Employee Benefits Cost?
Research Summary. Navigating the complexities of a company’s call center is a common experience, often accompanied by frustrations. Businesses that prioritize an efficient and seamless customer service experience through their call centers are more likely to outshine their competitors. Here are the essential call center statistics for 2026:
-
40% of American customers have discontinued business with a company following a negative customer service encounter, highlighting the importance of quality service.
-
96% of customers consider customer service to be a key factor influencing their purchasing decisions.
-
Consumers are 4X more likely to choose a competitor after a service-related issue compared to a problem with pricing or product quality.
-
Customers are inclined to spend 140% more following a positive service experience compared to a negative one.
-
The United States represents 29.5% of the global call center market as of 2023.
-
The U.S. call center market size stood at $23.9 billion in 2022.
-
36% of call centers have adopted cloud technology.
-
Cloud-based call centers report a 27% reduction in downtime.
-
Call centers with over 500 seats utilizing cloud technology save an average of 43%.
For further insights, we categorized the data as follows:
Customer Opinions | Company Opinions | Industry Insights | Trends and Projections

General Call Center Statistics
-
The global contact center market is valued at $339.40 billion.
The market is projected to expand to $496 billion by 2027.
-
59% of businesses actively survey customers for feedback.
Additionally, 61% track customer satisfaction, 52% monitor online reviews, and 24% implement formal customer advocacy programs.
-
U.S. businesses lose over $62 billion annually due to poor customer service.
A study by American Express indicates that customers are willing to spend 17% more with companies perceived to provide excellent customer service, a figure that continues to rise.
Customer Opinions on Call Centers Statistics
-
By 2021, over 65% of customers reported having significantly higher expectations for customer service compared to previous years.
This trend of increasing expectations has been evident over the past two decades.
-
77% of customers respond positively to businesses that are proactive in their customer service efforts.
This indicates a strong preference for companies that anticipate and address customer needs.
-
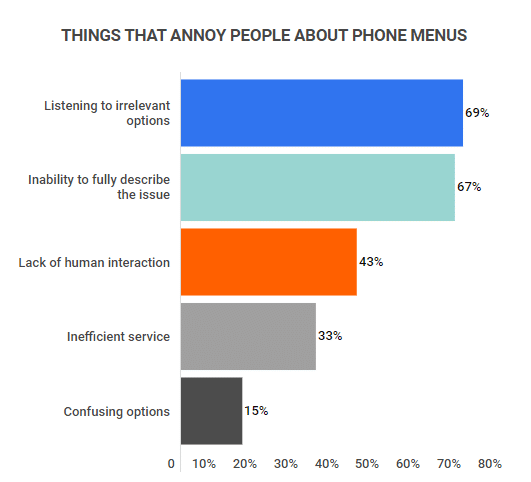
88% of customers prefer speaking with a live agent rather than navigating automated phone menus.
Common frustrations with automated menus include irrelevant options (69%), inability to fully articulate issues (67%), lack of human interaction (43%), and confusing options (15%).
-
90% of customers globally cite issue resolution as their primary concern in customer service interactions.
Furthermore, 90% emphasize the importance of receiving immediate responses to their inquiries.
-
As of 2018, 78% of customers preferred interactions without agents sounding scripted.
This reflects a notable shift towards valuing authentic communication since 2014.
Company Opinions on Call Centers Statistics
-
48% of service teams identify creating excellent customer service as their top priority.
In comparison, 45% focus on customer retention, 41% prioritize customer success, and 40% emphasize customer engagement.
-
67% of companies report significant growth by actively collecting customer feedback.
This underscores the critical role of customer service feedback in enhancing a call center’s reputation.
-
29% of businesses have implemented live chat software.
Among these, around 90% find live chat to be beneficial for improving customer support efficiency and reducing agent workloads.
-
42% of companies have adopted help desk systems to enhance customer experience.
Of those, 86% believe these systems have improved productivity and fostered customer loyalty.
Call Center Statistics by Industry
-
The finance sector hosts the highest percentage of call centers globally at 26%.
-
The government and public services sector has the lowest call center representation at 4%.
-
Government offices rank as the industry with the poorest customer service in the U.S. at 39% dissatisfaction.
-
61% of B2B companies have integrated live chat features.
Call Centers Trends and Projections
-
36% of call centers utilize cloud technology as of 2023.
Common cloud technologies include SaaS, hosted, hybrid, and private cloud solutions, which offer benefits like 27% reduced downtime and an average savings of 43%.
-
66% of call center businesses plan to invest in advanced analytics to enhance customer service.
Social media remains a primary customer support channel for many call centers.
-
AI and emerging technologies are projected to manage 70% of customer interactions by 2024.
The main drivers for this investment are improved customer experience and cost reduction.
-
The global call center AI market is expected to grow at a CAGR of 26.3% over the next decade.
It was valued at $959.80 million in 2020 and is projected to reach $9,949.61 million by 2030.
-
The call center market is forecasted to expand at a rate of 6.6% over the next five years.
By 2027, the market size is anticipated to reach $496 billion.
Call Center Statistics FAQ
-
What are typical call center metrics?
The key metrics that call centers monitor to evaluate productivity and performance include:
-
Average call abandonment rate
-
Average speed of answer
-
Occupancy rates
-
Percentage of calls blocked
-
First call resolution rates
This data helps call centers gauge their effectiveness and identify areas for improvement.
-
-
What is the average call center turnover rate?
The average call center turnover rate ranges from 30% to 45%. While this is considered high, it is lower than the national average of 57.3%.
Focusing on employee retention can significantly reduce training costs for call centers.
-
What is a good answer rate for a call center?
A good answer rate for a call center is to respond to approximately 80% of calls within 20 seconds. However, the average ‘time to answer’ can differ by industry.
-
Yes, call centers are known for their high stress levels. Common stressors include:
-
Handling irate customers
-
Repetitive tasks
-
Heavy workloads
-
Strict time constraints
-
Limited incentives
-
Learning and managing numerous tools and technologies
While call center jobs are often more stressful compared to other roles, there are numerous strategies to achieve a better work-life balance in this field.
-
-
What is the job outlook for call center jobs?
The job outlook for customer service representative positions is expected to decline from 2021 to 2031, according to the BLS. Despite the decrease, there are projected to be approximately 389,400 job openings each year for customer service representatives.
Conclusion
Accessing support through call centers is an experience many take for granted, yet it underpins a billion-dollar industry. Companies are continually seeking innovative ways to enhance their operations and improve customer satisfaction.
The United States holds a 29.5% share of the global call center market as of 2023, valued at $23.9 billion in 2022. A robust call center and customer service team are vital for a business’s success.
With 40% of consumers reporting they ceased business with a company following poor service, and customers likely to spend 140% more after a positive experience, the stakes are high.
The traditional image of call centers is evolving from merely a team of phone operators to sophisticated, tech-driven customer service hubs. Today, 36% of call centers leverage cloud technology, with significant cost savings reported.
Moreover, with 61% of B2B companies employing live chat features and projections indicating that AI will handle 70% of customer interactions by 2024, the industry is poised for transformative growth.
As these developments unfold, the call center sector is expected to continue its trajectory of growth and adaptation.
References
-
Statista. “US customers who stopped doing business due to poor customer service 2020.” Accessed on February 17, 2022.
-
Forbes. “50 Stats That Prove The Value Of Customer Experience.” Accessed on February 17, 2022.
-
Global News Wire. “Global Call Centers Industry.” Accessed on February 17, 2022.
-
Ibis World. “Telemarketing & Call Centers in the US.” Accessed on February 17, 2022.
-
Aberdeen. “Five Reasons Why Contact Centers Move to the Cloud.” Accessed on February 17, 2022.
-
Wheelhouse. “Cutting Call Center Costs with Cloud Based Solutions.” Accessed on February 17, 2022.
-
Statista. “Size of the call center market worldwide in 2020 with a forecast for 2027.” Accessed on February 17, 2022.
-
HubSpot. “The State of Customer Service in 2020.” Accessed on February 17, 2022.
-
ChatDesk. “The True Cost of Poor Customer Service.” Accessed on February 17, 2022.
-
Microsoft. “2017 STATE OF GLOBAL CUSTOMER SERVICE REPORT.” Accessed on February 17, 2022.
-
Netomi. “The State of Customer Service 2021.” Accessed on February 17, 2022.
-
Cision. “Nearly 90% of People Prefer Speaking to a Live Customer Service Agent on the Phone.” Accessed on February 17, 2022.
-
Statista. “Causes of Customer Service Frustration.” Accessed on February 17, 2022.
-
KPMG. “Global Customer Experience Excellence Report.” Accessed on February 17, 2022.
-
Software Advice. “What Customers Think About Call Center Scripts: 2014 vs. 2018.” Accessed on February 17, 2022.
-
CCW. “Future of the Contact Center: A Forecast.” Accessed on February 17, 2022.
-
Cision. “Call Center AI Market Size to Reach USD 9,949.61 Million by 2030.” Accessed on February 17, 2022.
-
Statista. “Primary Industries of Contact Centers Worldwide.” Accessed on February 17, 2022.
-
Forbes/Statista. “Customer Service Image.” Accessed on February 17, 2022.
-
99 Firms. “Live Chat Statistics.” Accessed on February 17, 2022.
-
Ring Central. “Call Center Metrics and KPIs.” Accessed on February 17, 2022.
-
Replicant. “Call Center Turnover: How to Eliminate Employee Attrition Costs.” Accessed on February 17, 2022.
-
Emplifi. “9 Important Contact Center Industry Standards.” Accessed on February 17, 2022.
-
U.S. Bureau of Labor Statistics. “Customer Service Representatives Occupational Outlook Handbook.” Accessed on February 23, 2023.
- Business Statistics
- Startup Statistics
- Cloud Adoption Statistics
- Customer Loyalty Statistics
- Nonprofit Statistics
- Affiliate Marketing Statistics
- Cart Abandonment Rate Statistics
- Ridesharing Statistics
- Call Center Statistics
- eLearning statistics
- Customer Service Statistics
- Customer Experience statistics
- Entrepreneur Statistics
- Outsourcing Statistics
- Gross Revenue for Marketing and Advertising
- Sales Statistics
- MBA Statistics
- Average Small Business Revenue + Profit Margin
- How Much Do Employee Benefits Cost?
Author
Sky Ariella is a professional freelance writer, originally from New York. She has been featured on websites and online magazines covering topics in career, travel, and lifestyle. She received her BA in psychology from Hunter College.


