- Industry Statistics
- Wedding Industry Statistics
- Yoga Industry Statistics
- Music Industry Statistics
- Landscaping Industry Statistics
- Bicycle Industry Statistics
- Coffee Industry Statistics
- Car Rental Industry Statistics
- Home Improvement Industry Statistics
- Insurance Industry Statistics
- Supplements Industry Statistics
- Golf Industry Statistics
- Fitness Industry Statistics
- US Media And Entertainment Industry Statistics
- Firearm Industry Statistics
- Financial Services Industry Statistics
- Health And Wellness Industry Statistics
- Trucking Industry Statistics
- Wine Industry Statistics
- Pet Industry Statistics
- Mobile App Industry Statistics
- Digital Marketing Industry Statistics
- Hotel Industry Statistics
- Retail Statistics
- Robotics Industry Statistics
- Jewelry Industry Statistics
- Appointment Scheduling statistics
- Restaurant Industry Statistics
- Food Delivery Statistics
- Food Truck Industry
- Fashion Industry
- Real Estate Industry
- US Film Industry
- US Beverage Industry
- USu202fFast Food Restaurants
- US Construction Industry
- US Book Industry
- Cosmetics Industry
- US Food Retail Industry
- US Pharmaceutical Industry
- US Healthcare Industry
- Airline Industry
- Automobile Industry
- Transportation Industry Statistics
- Event Industry Statistics
- Project Management Statistics
- Oil And Gas Industry Statistics
- Nursing Home Statistics
- Nursing Shortage Statistics
- Nursing Statistics
Research Summary. The coffee industry continues to be a vital source of caffeine for millions of people in the United States and around the world. Over the past decade, the consumption, production, and pricing of coffee have shown a consistent upward trend. This growth trajectory is expected to persist into the next decade and beyond, driven by evolving consumer preferences and market dynamics.
-
62% of Americans drink coffee daily.
-
The average American coffee drinker consumes approximately 3 cups of coffee each day.
-
Americans consume over 400 million cups of coffee daily.
-
Women in the U.S. spend an average of $2,327 per year on coffee, while men spend about $1,934.
-
The U.S. coffee industry generated annual revenue of $95.58 billion as of 2023.
For deeper insights, we have categorized the data in the following sections:
U.S. Consumption | U.S. Spending | Types of Coffee | Global Consumption | Global Production | Independent Shops | Trends

General Coffee Industry Statistics
-
The coffee industry contributes 1.6% to the United States GDP.
-
1.69 million Americans are employed in the coffee sector.
-
As of 2023, there are 38,411 coffee shops operating in the United States.
-
The global coffee market’s revenue reached $495.50 billion in 2023.
-
Coffee is the #2 most-consumed beverage globally.
-
In 2015, the coffee industry contributed $225.2 billion to the U.S. economy.
Coffee Industry Statistics by U.S. Coffee Consumption
-
150 million Americans regularly consume coffee.
This accounts for nearly 50% of the U.S. population.
-
The average American coffee drinker consumes between 2.7 to 3 cups per day.
This results in approximately 400 million cups consumed daily across the nation.
-
Nearly 50% of Americans aged 18-24 drink coffee.
In contrast, around 70% of those over 50 enjoy caffeine. About 33% of younger coffee drinkers prefer coffee from cafes, while less than 25% of older Americans do the same.
-
69% of Americans cite taste as the primary reason for drinking coffee.
62% drink it for an energy boost, while 34% say it helps them concentrate, and 18% use it to alleviate stress.
Coffee Industry Statistics by U.S. Coffee Spending
-
The average annual spending on coffee per American is $1,097.
-
The typical price for a brewed cup of coffee in the U.S. is $2.99.
-
60% of American coffee drinkers visit a branded coffee shop at least once a month.
Coffee Industry Statistics by Types of Coffee
-
Ground coffee represents 45.8% of retail sales in the industry as of 2022.
The retail sales of coffee in the U.S. exceeded $5 billion this year.
-
79% of coffee drinkers enjoy coffee at home, according to a recent survey.
About 36% mainly drink coffee at cafes or other locations outside their homes.
-
Single-cup coffee accounts for 36.5% of the industry’s retail sales in the U.S.
Starbucks holds approximately 18% of the single-cup coffee market share as of 2022.
-
Instant coffee constitutes 25% of all retail brewed coffee consumed worldwide.
Europe is the largest market for instant coffee, commanding 37% of the total market share.
-
One in five Americans under 40 consumes cold brew at least once a week.
This is significant considering cold brew was relatively unknown to many Americans just a decade ago.
-
The specialty coffee market is projected to grow at a CAGR of 13.62% from 2020 to 2025.
North America will contribute 41% of this growth, particularly from the U.S. and Canada.
Coffee Industry Statistics by Global Coffee Consumption
-
About 2 billion cups of coffee are consumed globally each day.
-
Finland ranks as the top country for coffee consumption per capita, with an average of 26.5 pounds consumed annually.
-
The leading countries for coffee consumption per capita are Finland (26.5 lbs), Norway (21.82 lbs), Iceland (19.84 lbs), Denmark (19.18 lbs), and the Netherlands (18.52 lbs).
Coffee Consumed per Capita by Country
Country Coffee Consumed Per Capita Finland 26.45 lbs Norway 21.82 lbs Iceland 19.84 lbs Denmark 19.18 lbs Netherlands 18.52 lbs Sweden 18 lbs Switzerland 17.42 lbs Belgium 15 lbs Luxembourg 14.33 lbs Canada 14.33 lbs Bosnia and Herzegovina 13.67 lbs Austria 13.45 lbs Italy 13 lbs Brazil 12.79 lbs Slovenia 12.79 lbs Germany 12.13 lbs Greece 11.9 lbs France 11.9 lbs Croatia 11.24 lbs Cyprus 10.8 lbs Lebanon 10.58 lbs Estonia 9.92 lbs Spain 9.92 lbs Portugal 9.48 lbs United States 9.26 lbs -
In 2022, global coffee consumption reached 166.63 million 60 kg bags.
-
McDonald’s and Starbucks combined account for 4% of the world’s coffee supply.
Coffee Industry Statistics by Global Coffee Production
-
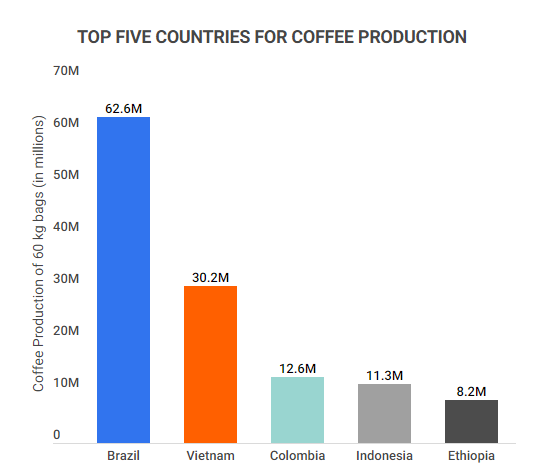
Brazil remains the leading coffee producer globally.
In 2022, Brazil produced 62.6 million 60 kg bags of coffee.
-
The top five coffee-producing countries are Brazil (62.6 million bags), Vietnam (30.2 million bags), Colombia (12.6 million bags), Indonesia (11.3 million bags), and Ethiopia (8.2 million bags).
Other significant producers include Uganda (6.6 million bags), India (6.2 million bags), Honduras (6 million bags), Peru (4.2 million bags), and Mexico (3.8 million bags).
-
The United States imported $5.68 billion worth of coffee in 2020.
The U.S. is the world’s leading coffee importer. The next largest importers in 2020 were Germany ($3.3 billion), France ($2.89 billion), Italy ($1.5 billion), and Canada ($1.2 billion).
Trade Value of Coffee Imported by Country
Country Trade value of coffee imported United States $5.68B Germany $3.39B France $2.89B Italy $1.50B Canada $1.21B Netherlands $1.19B Japan $1.18B Spain $1.01B United Kingdom $1.00B Switzerland $855.5K
Coffee Industry Statistics by Independent Coffee Shops
-
As of 2023, there are 37,189 independent coffee shops in the U.S.
This reflects a slight decline of 0.6% from 2019.

-
A 2019 survey indicated that 50% to 74% of independent coffee shops fail within their first five years.
This statistic was based on a survey of 232 independent coffee shops, many of which struggle to compete against larger corporate chains.
Coffee Industry Trends
-
Coffee consumption in the U.S. has risen by 5% since 2015.
-
Global coffee prices reached unprecedented levels in 2021, the highest in the previous decade.
-
The U.S. coffee industry is projected to experience an annual growth rate of 4.34% from 2022 to 2025.
Coffee Industry Statistics FAQ
-
How much is the coffee industry worth?
The global coffee industry is valued at $495.50 billion as of 2023. The United States contributes $95.58 billion, making it the largest market globally.
-
Is the coffee industry growing?
Yes, the coffee industry is experiencing growth both in the U.S. and worldwide. The global coffee market is projected to grow at a CAGR of 5.30% from 2022 to 2025, while the U.S. market is expected to grow at 4.34% annually during the same period.
-
Who leads the coffee industry?
The U.S. is the leading country in the coffee industry with $90.2 billion in revenue as of 2022. However, it is not the largest producer due to climatic conditions.
-
Brazil (37.4% market share)
-
Vietnam (17.1%)
-
Colombia (8.4%)
-
Indonesia (7.1%)
-
Ethiopia (4.3%)
-
-
How competitive is the coffee industry?
Competition in the coffee industry is intense, both domestically and internationally. Major corporations like Starbucks, McDonald’s, Kraft Heinz, and Nestle dominate the market, alongside many independently-owned coffee shops vying for customer loyalty. The industry presents numerous challenges for new entrants.
-
What age group consumes the most coffee?
Individuals aged 70 and over are the highest consumers of coffee in the U.S. as of 2022. They average 2.18 cups per day, compared to 2.15 cups per day for those aged 25 to 29.
-
Which country consumes the most coffee per capita?
Finland has the highest coffee consumption per capita, averaging 26.45 lbs per person annually.
Other high-consuming nations include Norway (21.82 lbs), Iceland (19.84 lbs), Denmark (19.18 lbs), and the Netherlands (18.52 lbs).
Conclusion
For coffee enthusiasts, their daily cup of coffee is essential for a productive day. This commitment to coffee solidifies its position as the second most popular beverage worldwide, following tea.
As of 2023, the global coffee industry is valued at an impressive $495.50 billion, with Brazil leading in coffee production, having produced 63.4 million bags in 2020.
Conversely, the United States stands out as the largest coffee importer, having imported over $5 billion worth of coffee in 2020. The demand is evident, as 62% of Americans drink coffee daily, averaging three cups each.
This results in a staggering consumption of over 400 million cups of coffee per day. The coffee industry supports 1.69 million jobs in the U.S., contributing $95.58 billion to the overall value of the global coffee market.
American coffee consumption has consistently increased, rising by 5% since 2015, and is projected to continue growing at a CAGR of 4.34% until 2025. This growth suggests that coffee will become even more integral to the U.S. economy in the years to come.
References
-
National Coffee Association USA. NCA releases 2020 National Coffee Data Trends, the “Atlas of American Coffee”. Accessed on April 11, 2022
-
Yahoo! Finance. Here’s How Much Americans Are Spending on Coffee – And Smarter Ways To Use That Money Instead. Accessed on April 11, 2022
-
National Coffee Association USA. The Economic Impact of the Coffee Industry
-
Statista. Coffee – Worldwide | Statista Market Forecast. Accessed on April 11, 2022
-
Best Toppers. Top 10 Widely Consumed Drinks in The World!! – Best Toppers. Accessed on April 11, 2022
-
Statista. • US demographics of coffee drinkers 2019. Accessed on April 11, 2022
-
Deals on Health. 33 Coffee Statistics: What All Coffee Drinkers Need to Know [2021]. Accessed on April 11, 2022
-
Survey Monkey. 5 coffee statistics that reveal why we can’t resist our java. Accessed on April 11, 2022
-
Renolon. 20 Fascinating Coffee Spending Statistics Need to Know in 2022. Accessed on April 11, 2022
-
National Coffee. What a Cup of Coffee Really Costs. Accessed on April 11, 2022
-
E-Importz. Coffee Statistics. Accessed on April 11, 2022
-
Linch Pinseo. Coffee And Tea Marketing & Industry Trends Shaping 2022 By Linchpin SEO. Accessed on April 11, 2022
-
Statista. US coffee market – statistics & facts | Statista. Accessed on April 11, 2022
-
Reuters. Americans are drinking a daily cup of coffee at the highest level in six years: survey. Accessed on April 11, 2022
-
Statista. Statistics & Facts on the Single-serve Coffee Market. Accessed on April 11, 2022
-
Perfect Grind Daily. The Rise Of Instant Coffee – Perfect Daily Grind. Accessed on April 11, 2022
-
PR Newswire. Specialty Coffee Shops Market to Record 12.08% of YOY Growth Rate in 2021 | Barista Coffee Co. Ltd – One of the Leading Company Operates Coffee Cafes & Serves Customers throughout India. Accessed on April 11, 2022
-
British Coffee Association. Coffee Consumption. Accessed on April 11, 2022
-
World Atlas. The Top Coffee-Consuming Countries – WorldAtlas. Accessed on April 11, 2022
-
Statista. • Global coffee consumption, 2020/21. Accessed on April 11, 2022
-
Cone. Starbucks and McDonald’s Unite to Push Industry Toward More Sustainable Packaging — Cone Communications. Accessed on April 11, 2022
-
We Forum. Which country produced the most coffee in 2020? | World Economic Forum. Accessed on April 11, 2022
-
Statista. • Coffee imports: leading countries worldwide 2020. Accessed on April 11, 2022
-
Fabled, Medium. Why do 74% of independent coffee shops fail in the first five years. Accessed on April 11, 2022
-
Fortune. Coffee prices hit 10-year high, up more than any commodity in 2021. Accessed on April 11, 2022
-
Mordor Intelligence. Coffee Market Size, Share, Growth, Report | 2022 – 27. Accessed on April 11, 2022
-
Statista. • Total coffee per capita consumption United States by age group 2020. Accessed on April 11, 2022
-
Statista. Coffee – United States | Statista Market Forecast). Accessed on March 19, 2023
-
Statista. • Number of coffeehouse stores US 2022. Accessed on March 19, 2023
-
United States Department of Agriculture. Coffee: World Markets and Trade. Accessed on March 19, 2023
- Industry Statistics
- Wedding Industry Statistics
- Yoga Industry Statistics
- Music Industry Statistics
- Landscaping Industry Statistics
- Bicycle Industry Statistics
- Coffee Industry Statistics
- Car Rental Industry Statistics
- Home Improvement Industry Statistics
- Insurance Industry Statistics
- Supplements Industry Statistics
- Golf Industry Statistics
- Fitness Industry Statistics
- US Media And Entertainment Industry Statistics
- Firearm Industry Statistics
- Financial Services Industry Statistics
- Health And Wellness Industry Statistics
- Trucking Industry Statistics
- Wine Industry Statistics
- Pet Industry Statistics
- Mobile App Industry Statistics
- Digital Marketing Industry Statistics
- Hotel Industry Statistics
- Retail Statistics
- Robotics Industry Statistics
- Jewelry Industry Statistics
- Appointment Scheduling statistics
- Restaurant Industry Statistics
- Food Delivery Statistics
- Food Truck Industry
- Fashion Industry
- Real Estate Industry
- US Film Industry
- US Beverage Industry
- USu202fFast Food Restaurants
- US Construction Industry
- US Book Industry
- Cosmetics Industry
- US Food Retail Industry
- US Pharmaceutical Industry
- US Healthcare Industry
- Airline Industry
- Automobile Industry
- Transportation Industry Statistics
- Event Industry Statistics
- Project Management Statistics
- Oil And Gas Industry Statistics
- Nursing Home Statistics
- Nursing Shortage Statistics
- Nursing Statistics
Author
Sky Ariella is a professional freelance writer, originally from New York. She has been featured on websites and online magazines covering topics in career, travel, and lifestyle. She received her BA in psychology from Hunter College.