Find a Job You Really Want In

If you ask twenty Americans of seemingly the same background about their ancestry, there’s a decent chance you’ll get twenty different answers.
For some people, their ancestry is their race or ethnic background — for others, it’s the country their ancestors were from — for others still, it’s the country that they themselves were either born in or have otherwise come to call home.
Ancestry isn’t the same as race, which is often a series of assumptions made based on a person’s skin color or external appearance by the people around them. Although the two are often related, ancestry is more of an individual choice of what parts of their background or family history that they choose (or are able to) remember — and, in the case of the US Census, it’s also self-reported, which can lead to some interesting answers.
Given the fact that so much of ancestry is up to individual choice, we were curious if anyone from the same ancestral background had anything in common at all, specifically in terms of the careers that they’ve chosen to spend their lives doing. So we took a look at the American Community Survey’s data for each reported ancestry and found out what the most common job was for each background.
You’ll find the full list of all ancestries and their most common jobs at the end of the article, but first let’s take a look at the top twenty options and talk a little bit about the data itself.
So What Do We See?
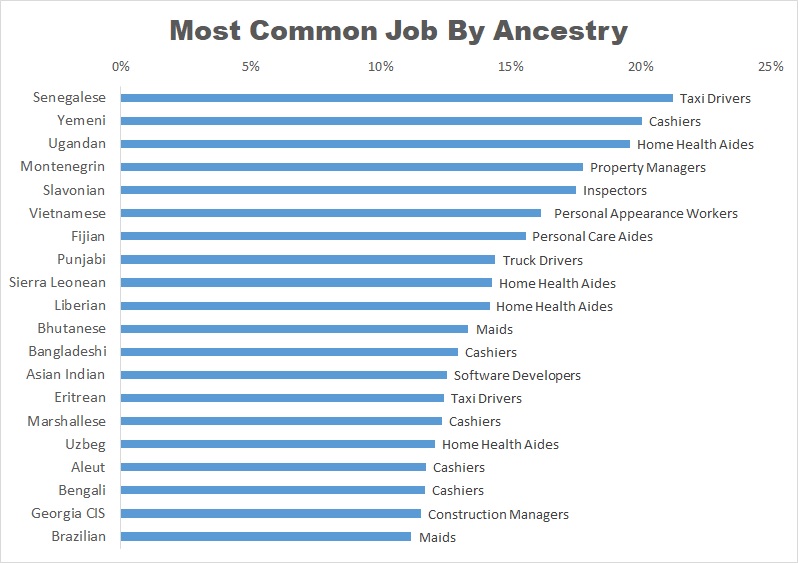
In the chart above, you’ll find the top 20 ancestries whose most commonly listed job also represented the largest percentages of their overall population in relation to the other ancestries in our data.
All of the data in this chart and in the table below was found in the American Community Survey’s Public Use Microdata Sample, or PUMS. This particular data is from the 2016 PUMS data set, which was originally released on October 19, 2017, so it’s about as fresh as you can get.
A link to the 5-year PUMS data used in this chart can be found here.
As you can see, the most common options for pretty much every reported ancestry include service positions like taxi and truck drivers, chauffeurs, personal appearance workers, cashiers, and others. On the full list, the top job is Miscellaneous Managers, Including Funeral Service Managers And Postmasters And Mail Superintendents, which is kind of a hilarious mouthful.
But in the top twenty seen above, a slight majority of ancestries lean toward the nursing side of things, with those of Ugandan, Sierra Leonean, and Liberian ancestry all listing their employment as Nursing, Psychiatric, and Home Health Aides.
Interestingly, looking at data as a whole, there’s almost an inverse relationship between how many responders there are for each ancestry (which is not represented in the chart) and what percentage of those responders share the most common job for that ancestry. The relationship isn’t perfectly inverse, but the tendency is there.
This begs a few different questions — namely, why is this occurring? Are people with certain positions more likely to report their ancestries in the census than others are? Or is it that the smaller a minority, the fewer job opportunities there are for that minority in whatever country they live in?
From the limited data we have, it’s tough to tell. But there are a few other points from this data that are worth addressing.
You see, ancestries for the census are self-reported, which can sometimes lead to some confusion between different respondents (to say the least). What kind of confusion, you ask? Well…
St Lucia Islander — Social Workers
Percent of this Ancestry with Most Common Job: 7.79%
As far as Google seems to be aware, the term “St Lucia Islander” isn’t strongly associated with a particular ethnic group — it appears to just be denoting anyone from St Lucia Island. It’s very possible that this writer is just unaware of the term St Lucia Islander being the common name for native citizens from the island — it’s also possible that people of all ethnic backgrounds who come from St Lucia make use of the term.
Either way it’s interesting that this group’s most common job is Social Worker, given that the little island itself is barely over 200 square miles in total area.
Scotch Irish — Miscellaneous Managers, Including Funeral Service Managers And Postmasters And Mail Superintendents
Percent of this Ancestry with Most Common Job: 3.37%
Scotch Irish is a largely American term for the Irish people of Ulster, the Irish region closest to Scotland, who emigrated to America in large numbers in the early 1800s. The Scotch Irish for the most part came to America for reasons of religious freedom — the term was mostly used to differentiate these settlers from the later Irish immigrants who came from all over Ireland due to the Irish Potato Famine.
There are a lot of different and interesting countries of ancestry on this list, so this particular entry would not be all that interesting on its own were it not for our following entry on this list.
Irish Scotch — Elementary And Middle School Teachers
Percent of this Ancestry with Most Common Job: 3.49%
Yeah, so…this is the same. It’s the same thing. We can’t stress enough that these ancestries are self-reported, and that people, on the whole, are morons.
Scotch Irish is already a fairly meaningless term, as most of these people have no actual Scottish ancestry. What’s more, people outside of America (the Irish included) don’t even use the distinction — it’s just us. Which makes it doubly stupid that this item shows up twice on our list.
Not to mention the fact that the top job for Scotch Irish is Miscellaneous Manager, while the top job for Irish Scotch is Elementary and Middle School Teacher.
Appalachian — First-Line Supervisors Of Retail Sales Workers
Percent of this Ancestry with Most Common Job: 4.78%
Much as with the St Lucia Islander, we took a double take with this one. Sure, it looks incorrect at first glance — the Appalachians these days are a region largely made up of white immigrants, after all — but it’s entirely possible that this is just a Native American group of whose existence we weren’t aware.
But the Native American tribes of the greater Appalachian region are actually fairly well documented. They include groups as diverse as Cherokee, Muskogee, Algonquin, Monangahela, Melungeon — but members of these groups usually self-identify as being either from one of these specific tribes or as just being “Native American.” But in either case, the term “Appalachian” is rarely if ever used by these groups as a primary identifier.
Which means that, given that the largest ethnic group in Appalachia today are in fact the Scotch Irish, this is most likely their fault once again.
Americans — Driver/Sales Workers And Truck Drivers
Percent of this Ancestry with Most Common Job: 2.98%
We know what you’re thinking. The people who report that they’re “Americans” could be a perfectly diverse group of people, all of whom are so wonderfully proud to have been born in the good old US of A that they just felt compelled to list that as their ancestry in the census.
That’s definitely one way to read the data, as a hopeful expression of the kind of multicultural unity that’s possible in a melting pot country like America.
But an extraordinary amount of these respondents are white, and the majority of them come from the deep south — a significant enough amount that it’s hard to ignore some of the implications of this.
Now, there’s still the option that respondents in this category simply don’t know where their families have come from — after all, many American families immigrated here so long ago that they might not have kept track of where exactly their families originated. That’s a perfectly logical interpretation.
Then there’s the more cynical possibility that those reporting themselves as “Americans” are in fact white nativists trying to make a political statement about who should or should not have the right to live in this country.
The last — and potentially most damning — possibility is that this is the Scotch Irish yet again, a notion that fills me with a righteous fury.
Wrapping Up
That’s all for now! Below you’ll find a table of all US Census ancestries and their most common occupations, but there’s more to see here at Zippia.
No matter your own current position, you can search for jobs yourself using our official search page at Zippia.com.
Or are you looking for more articles like this one? Here’s a look at which US states have the highest (and lowest) divorce rates in the nation.
Full Table of the Most Common Jobs by Ancestry
| Ancestry | Occupation | Percent |
|---|---|---|
| Afghan | Retail Salespersons | 7.83% |
| African | Nursing, Psychiatric, And Home Health Aides | 3.87% |
| African American | Cashiers | 4.05% |
| Afro | Physicians And Surgeons | 7.63% |
| Afro American | Unemployed And Last Worked 5 Years Ago Or Never Worked | 4.05% |
| Albanian | Janitors And Building Cleaners | 4.72% |
| Aleut | Cashiers | 11.75% |
| Algerian | Taxi Drivers And Chauffeurs | 5.11% |
| Alsatian | Chief Executives And Legislators | 8.56% |
| American | Driver/Sales Workers And Truck Drivers | 2.98% |
| American Indian | Cashiers | 3.34% |
| Anglo | Elementary And Middle School Teachers | 4.34% |
| Antigua and Barbuda | Carpenters | 6.81% |
| Appalachian | First-Line Supervisors Of Retail Sales Workers | 4.78% |
| Arab | Cashiers | 6.64% |
| Arabic | Cashiers | 6.98% |
| Argentinean | Miscellaneous Managers, Including Funeral Service Managers And Postmasters And Mail Superintendents | 3.11% |
| Armenian | Retail Salespersons | 3.69% |
| Asian | Registered Nurses | 4.71% |
| Asian Indian | Software Developers, Applications And Systems Software | 12.57% |
| Assyrian | Personal Care Aides | 5.51% |
| Australian | Miscellaneous Managers, Including Funeral Service Managers And Postmasters And Mail Superintendents | 4.98% |
| Austrian | Miscellaneous Managers, Including Funeral Service Managers And Postmasters And Mail Superintendents | 3.92% |
| Bahamian | First-Line Supervisors Of Retail Sales Workers | 4.52% |
| Bangladeshi | Cashiers | 12.98% |
| Barbadian | Miscellaneous Managers, Including Funeral Service Managers And Postmasters And Mail Superintendents | 6.64% |
| Basque | Elementary And Middle School Teachers | 3.29% |
| Belgian | Secretaries And Administrative Assistants | 3.95% |
| Belizean | Cashiers | 5.40% |
| Belorussian | Software Developers, Applications And Systems Software | 7.04% |
| Bengali | Cashiers | 11.70% |
| Bhutanese | Maids And Housekeeping Cleaners | 13.37% |
| Black | Cashiers | 4.25% |
| Bohemian | Miscellaneous Managers, Including Funeral Service Managers And Postmasters And Mail Superintendents | 4.11% |
| Bolivian | Maids And Housekeeping Cleaners | 8.72% |
| Bosnian and Herzegovinian | Driver/Sales Workers And Truck Drivers | 6.19% |
| Brazilian | Maids And Housekeeping Cleaners | 11.18% |
| British | Miscellaneous Managers, Including Funeral Service Managers And Postmasters And Mail Superintendents | 4.04% |
| British Isles | Postsecondary Teachers | 4.46% |
| British West Indian | Cooks | 7.61% |
| Bulgarian | Accountants And Auditors | 5.32% |
| Burmese | Butchers And Other Meat, Poultry, And Fish Processing Workers | 9.01% |
| Cajun | Elementary And Middle School Teachers | 4.11% |
| Cambodian | Cashiers | 5.51% |
| Cameroonian | Nursing, Psychiatric, And Home Health Aides | 7.61% |
| Canadian | Miscellaneous Managers, Including Funeral Service Managers And Postmasters And Mail Superintendents | 3.59% |
| Cantonese | Waiters And Waitresses | 9.15% |
| Cape Verdean | Nursing, Psychiatric, And Home Health Aides | 8.10% |
| Celtic | Cashiers | 4.17% |
| Central American | Secretaries And Administrative Assistants | 5.61% |
| Central American Indian | Sewing Machine Operators | 4.44% |
| Central European | Postsecondary Teachers | 9.55% |
| Chaldean | First-Line Supervisors Of Retail Sales Workers | 9.14% |
| Chamorro | First-Line Supervisors Of Retail Sales Workers | 4.95% |
| Cherokee | Cashiers | 3.80% |
| Chicano | Cooks | 4.54% |
| Chilean | Miscellaneous Managers, Including Funeral Service Managers And Postmasters And Mail Superintendents | 3.70% |
| Chinese | Postsecondary Teachers | 3.79% |
| Colombian | Maids And Housekeeping Cleaners | 4.10% |
| Congolese | Cashiers | 8.21% |
| Costa Rican | Maids And Housekeeping Cleaners | 4.18% |
| Creole | Cashiers | 3.66% |
| Croatian | Miscellaneous Managers, Including Funeral Service Managers And Postmasters And Mail Superintendents | 4.34% |
| Cuban | Driver/Sales Workers And Truck Drivers | 4.77% |
| Czech | Elementary And Middle School Teachers | 3.89% |
| Czechoslovakian | Elementary And Middle School Teachers | 4.64% |
| Danish | Miscellaneous Managers, Including Funeral Service Managers And Postmasters And Mail Superintendents | 4.21% |
| Dominican | Janitors And Building Cleaners | 5.03% |
| Dutch | Miscellaneous Managers, Including Funeral Service Managers And Postmasters And Mail Superintendents | 3.18% |
| Dutch West Indian | Nursing, Psychiatric, And Home Health Aides | 6.54% |
| East Indian | Secretaries And Administrative Assistants | 4.42% |
| Eastern European | Lawyers, And Judges, Magistrates, And Other Judicial Workers | 4.74% |
| Ecuadorian | Construction Laborers | 4.70% |
| Egyptian | Physicians And Surgeons | 4.43% |
| English | Miscellaneous Managers, Including Funeral Service Managers And Postmasters And Mail Superintendents | 3.51% |
| Eritrean | Taxi Drivers And Chauffeurs | 12.44% |
| Eskimo | Electricians | 6.66% |
| Estonian | Dental Hygienists | 6.09% |
| Ethiopian | Taxi Drivers And Chauffeurs | 10.31% |
| Eurasian | Postsecondary Teachers | 6.37% |
| European | Elementary And Middle School Teachers | 4.02% |
| Fijian | Personal Care Aides | 15.59% |
| Filipino | Registered Nurses | 9.00% |
| Finnish | Miscellaneous Managers, Including Funeral Service Managers And Postmasters And Mail Superintendents | 3.62% |
| Flemish | Miscellaneous Installation, Maintenance, And Repair Workers, Including Wind Turbine Service Technicians | 8.73% |
| French | Miscellaneous Managers, Including Funeral Service Managers And Postmasters And Mail Superintendents | 2.98% |
| French Canadian | Miscellaneous Managers, Including Funeral Service Managers And Postmasters And Mail Superintendents | 3.22% |
| Georgia CIS | Construction Managers | 11.55% |
| German | Miscellaneous Managers, Including Funeral Service Managers And Postmasters And Mail Superintendents | 3.14% |
| German Russian | Personal Care And Service Workers, All Other | 4.36% |
| Germanic | Miscellaneous Managers, Including Funeral Service Managers And Postmasters And Mail Superintendents | 4.29% |
| Ghanaian | Nursing, Psychiatric, And Home Health Aides | 8.80% |
| Greek | Miscellaneous Managers, Including Funeral Service Managers And Postmasters And Mail Superintendents | 3.66% |
| Grenadian | Nursing, Psychiatric, And Home Health Aides | 8.52% |
| Guamanian | Stock Clerks And Order Fillers | 7.43% |
| Guatemalan | Maids And Housekeeping Cleaners | 6.92% |
| Guyanese | Nursing, Psychiatric, And Home Health Aides | 7.70% |
| Haitian | Nursing, Psychiatric, And Home Health Aides | 10.10% |
| Hawaiian | Retail Salespersons | 3.36% |
| Hispanic | Cashiers | 3.57% |
| Hmong | Miscellaneous Assemblers And Fabricators | 5.77% |
| Honduran | Construction Laborers | 8.50% |
| Hungarian | Miscellaneous Managers, Including Funeral Service Managers And Postmasters And Mail Superintendents | 3.57% |
| Icelander | Elementary And Middle School Teachers | 3.95% |
| Indian | Driver/Sales Workers And Truck Drivers | 4.12% |
| Indonesian | Chefs And Head Cooks | 5.62% |
| Iranian | Retail Salespersons | 4.84% |
| Iraqi | Driver/Sales Workers And Truck Drivers | 6.54% |
| Irish | Miscellaneous Managers, Including Funeral Service Managers And Postmasters And Mail Superintendents | 3.15% |
| Irish Scotch | Elementary And Middle School Teachers | 3.49% |
| Israeli | Miscellaneous Managers, Including Funeral Service Managers And Postmasters And Mail Superintendents | 5.53% |
| Italian | Miscellaneous Managers, Including Funeral Service Managers And Postmasters And Mail Superintendents | 3.43% |
| Jamaican | Nursing, Psychiatric, And Home Health Aides | 8.42% |
| Japanese | Miscellaneous Managers, Including Funeral Service Managers And Postmasters And Mail Superintendents | 3.57% |
| Jordanian | Cashiers | 9.82% |
| Kenyan | Nursing, Psychiatric, And Home Health Aides | 7.86% |
| Korean | First-Line Supervisors Of Retail Sales Workers | 3.67% |
| Kurdish | Janitors And Building Cleaners | 6.18% |
| Laotian | Miscellaneous Assemblers And Fabricators | 5.18% |
| Latin | Janitors And Building Cleaners | 4.09% |
| Latin American | Miscellaneous Assemblers And Fabricators | 7.18% |
| Latino | Construction Laborers | 3.67% |
| Latvian | Miscellaneous Managers, Including Funeral Service Managers And Postmasters And Mail Superintendents | 3.49% |
| Lebanese | Miscellaneous Managers, Including Funeral Service Managers And Postmasters And Mail Superintendents | 4.47% |
| Liberian | Nursing, Psychiatric, And Home Health Aides | 14.19% |
| Lithuanian | Miscellaneous Managers, Including Funeral Service Managers And Postmasters And Mail Superintendents | 3.68% |
| Luxemburger | Bookkeeping, Accounting, And Auditing Clerks | 4.78% |
| Macedonian | Janitors And Building Cleaners | 8.05% |
| Malaysian | Butchers And Other Meat, Poultry, And Fish Processing Workers | 4.88% |
| Maltese | Retail Salespersons | 4.59% |
| Marshallese | Cashiers | 12.37% |
| Mexican | Cooks | 3.62% |
| Mexican American | Cashiers | 4.68% |
| Mexican American Indian | Cashiers | 4.86% |
| Mexican Indian | Janitors And Building Cleaners | 4.33% |
| Mexican State | Construction Laborers | 5.94% |
| Mexicano | Maids And Housekeeping Cleaners | 5.65% |
| Micronesian | Cooks | 9.95% |
| Mideast | First-Line Supervisors Of Retail Sales Workers | 5.03% |
| Mixture | Miscellaneous Managers, Including Funeral Service Managers And Postmasters And Mail Superintendents | 3.36% |
| Moldavian | Driver/Sales Workers And Truck Drivers | 8.15% |
| Mongolian | Driver/Sales Workers And Truck Drivers | 9.14% |
| Montenegrin | Property, Real Estate, And Community Association Managers | 17.77% |
| Moroccan | Retail Salespersons | 5.22% |
| Native American | Cashiers | 3.37% |
| Negro | Personal Care Aides | 5.73% |
| Nepali | Cashiers | 7.05% |
| New Zealander | Miscellaneous Managers, Including Funeral Service Managers And Postmasters And Mail Superintendents | 6.43% |
| Nicaraguan | Maids And Housekeeping Cleaners | 5.58% |
| Nigerian | Registered Nurses | 9.46% |
| North African | Waiters And Waitresses | 6.13% |
| North American | First-Line Supervisors Of Office And Administrative Support Workers | 3.87% |
| Northern European | Miscellaneous Managers, Including Funeral Service Managers And Postmasters And Mail Superintendents | 4.40% |
| Norwegian | Elementary And Middle School Teachers | 3.37% |
| Not reported | Cashiers | 2.96% |
| Okinawan | Fishing And Hunting Workers | 4.61% |
| Other Arab | Elementary And Middle School Teachers | 5.40% |
| Other Asian | Miscellaneous Managers, Including Funeral Service Managers And Postmasters And Mail Superintendents | 5.69% |
| Other groups | Postsecondary Teachers | 4.59% |
| Other Pacific | Cashiers | 8.65% |
| Other responses | Lawyers, And Judges, Magistrates, And Other Judicial Workers | 4.06% |
| Other Subsaharan African | Nursing, Psychiatric, And Home Health Aides | 7.00% |
| Other West Indian | Registered Nurses | 4.26% |
| Pacific Islander | Customer Service Representatives | 5.21% |
| Pakistani | Cashiers | 6.85% |
| Palestinian | Cashiers | 7.37% |
| Panamanian | Janitors And Building Cleaners | 3.37% |
| Paraguayan | Maids And Housekeeping Cleaners | 8.77% |
| Pennsylvania German | Farmers, Ranchers, And Other Agricultural Managers | 3.28% |
| Peruvian | Maids And Housekeeping Cleaners | 3.69% |
| Polish | Miscellaneous Managers, Including Funeral Service Managers And Postmasters And Mail Superintendents | 3.31% |
| Polynesian | Customer Service Representatives | 8.42% |
| Portuguese | Miscellaneous Managers, Including Funeral Service Managers And Postmasters And Mail Superintendents | 2.82% |
| Prussian | Registered Nurses | 4.04% |
| Puerto Rican | Cashiers | 3.84% |
| Punjabi | Driver/Sales Workers And Truck Drivers | 14.42% |
| Rom | Laborers And Freight, Stock, And Material Movers, Hand | 6.16% |
| Romanian | Miscellaneous Managers, Including Funeral Service Managers And Postmasters And Mail Superintendents | 4.20% |
| Russian | Miscellaneous Managers, Including Funeral Service Managers And Postmasters And Mail Superintendents | 3.50% |
| Salvadoran | Maids And Housekeeping Cleaners | 7.15% |
| Samoan | Laborers And Freight, Stock, And Material Movers, Hand | 5.89% |
| Saudi Arabian | Postsecondary Teachers | 10.76% |
| Scandinavian | Miscellaneous Managers, Including Funeral Service Managers And Postmasters And Mail Superintendents | 3.67% |
| Scotch Irish | Miscellaneous Managers, Including Funeral Service Managers And Postmasters And Mail Superintendents | 3.37% |
| Scottish | Miscellaneous Managers, Including Funeral Service Managers And Postmasters And Mail Superintendents | 3.88% |
| Senegalese | Taxi Drivers And Chauffeurs | 21.27% |
| Serbian | Driver/Sales Workers And Truck Drivers | 4.24% |
| Sicilian | Miscellaneous Managers, Including Funeral Service Managers And Postmasters And Mail Superintendents | 3.37% |
| Sierra Leonean | Nursing, Psychiatric, And Home Health Aides | 14.30% |
| Slavic | Miscellaneous Managers, Including Funeral Service Managers And Postmasters And Mail Superintendents | 3.89% |
| Slavonian | Inspectors, Testers, Sorters, Samplers, And Weighers | 17.50% |
| Slovak | Miscellaneous Managers, Including Funeral Service Managers And Postmasters And Mail Superintendents | 3.93% |
| Slovene | Elementary And Middle School Teachers | 4.27% |
| Somali | Laborers And Freight, Stock, And Material Movers, Hand | 7.44% |
| South African | Miscellaneous Managers, Including Funeral Service Managers And Postmasters And Mail Superintendents | 7.33% |
| South American | Miscellaneous Managers, Including Funeral Service Managers And Postmasters And Mail Superintendents | 4.77% |
| South American Indian | Other Teachers And Instructors | 10.92% |
| Southern European | Elementary And Middle School Teachers | 6.82% |
| Spaniard | Customer Service Representatives | 2.75% |
| Spanish | Retail Salespersons | 2.62% |
| Spanish American | Cashiers | 3.89% |
| Sri Lankan | Postsecondary Teachers | 7.11% |
| St Lucia Islander | Social Workers | 7.79% |
| Sudanese | Taxi Drivers And Chauffeurs | 6.63% |
| Swedish | Elementary And Middle School Teachers | 3.52% |
| Swiss | Miscellaneous Managers, Including Funeral Service Managers And Postmasters And Mail Superintendents | 3.70% |
| Syrian | First-Line Supervisors Of Retail Sales Workers | 5.32% |
| Taiwanese | Software Developers, Applications And Systems Software | 4.65% |
| Texas | Miscellaneous Managers, Including Funeral Service Managers And Postmasters And Mail Superintendents | 6.25% |
| Thai | Waiters And Waitresses | 8.88% |
| Tibetan | Maids And Housekeeping Cleaners | 7.86% |
| Tongan | Stock Clerks And Order Fillers | 6.12% |
| Trinidadian Tobagonian | Nursing, Psychiatric, And Home Health Aides | 7.00% |
| Turkestani | Postsecondary Teachers | 8.34% |
| Turkish | Postsecondary Teachers | 5.69% |
| Ugandan | Nursing, Psychiatric, And Home Health Aides | 19.61% |
| Ukrainian | Miscellaneous Managers, Including Funeral Service Managers And Postmasters And Mail Superintendents | 3.97% |
| Uncodable entries | Miscellaneous Managers, Including Funeral Service Managers And Postmasters And Mail Superintendents | 3.16% |
| United States | Secretaries And Administrative Assistants | 3.04% |
| Uruguayan | Driver/Sales Workers And Truck Drivers | 8.57% |
| Uzbeg | Nursing, Psychiatric, And Home Health Aides | 12.11% |
| Venezuelan | Miscellaneous Managers, Including Funeral Service Managers And Postmasters And Mail Superintendents | 3.44% |
| Vietnamese | Miscellaneous Personal Appearance Workers | 16.17% |
| Vincent-Grenadine Islander | Nursing, Psychiatric, And Home Health Aides | 11.10% |
| Welsh | Miscellaneous Managers, Including Funeral Service Managers And Postmasters And Mail Superintendents | 3.67% |
| West Indian | Nursing, Psychiatric, And Home Health Aides | 6.42% |
| Western African | Miscellaneous Managers, Including Funeral Service Managers And Postmasters And Mail Superintendents | 4.97% |
| Western European | Miscellaneous Managers, Including Funeral Service Managers And Postmasters And Mail Superintendents | 4.69% |
| White | Cashiers | 2.80% |
| Yemeni | Cashiers | 20.04% |
| Yugoslavian | Miscellaneous Managers, Including Funeral Service Managers And Postmasters And Mail Superintendents | 4.83% |
Author
Ryan Morris was a writer for the Zippia Advice blog who tried to make the job process a little more entertaining for all those involved. He obtained his BA and Masters from Appalachian State University.