- Business Statistics
- Startup Statistics
- Cloud Adoption Statistics
- Customer Loyalty Statistics
- Nonprofit Statistics
- Affiliate Marketing Statistics
- Cart Abandonment Rate Statistics
- Ridesharing Statistics
- Call Center Statistics
- eLearning statistics
- Customer Service Statistics
- Customer Experience statistics
- Entrepreneur Statistics
- Outsourcing Statistics
- Gross Revenue for Marketing and Advertising
- Sales Statistics
- MBA Statistics
- Average Small Business Revenue + Profit Margin
- How Much Do Employee Benefits Cost?
17 Essential Startup Statistics [2026]: Reasons for Failure, Profitability, and More
Research Summary. Creating a successful startup embodies the entrepreneurial spirit, representing ambition and innovation. While the journey of launching a startup is fraught with challenges, including financial risks and market competition, the potential rewards can be immense.
The startup landscape is evolving, and understanding current trends is crucial for aspiring entrepreneurs. To provide you with a clear picture, we have compiled a comprehensive list of essential startup statistics for 2026. Here’s what our research reveals:
-
The US is home to over 80,000 startups as of early 2026.
-
Startups maintain a 50% five-year survival rate.
-
Globally, there are over 1,500 billion-dollar startups (unicorns).
-
65% of startups fail due to premature scaling.
Startup Statistics by Survival Rate
Investing in a startup is inherently risky, with high failure rates posing significant challenges. Here are key statistics regarding startup survival and failure:
-
Approximately 10% of startups fail within their first year.
Many entrepreneurs are misled by the optimistic 90% survival rate during the initial year. Early successes can lead to premature scaling and overspending, ultimately jeopardizing the startup’s future.
-
Up to 70% of startups fail between two to five years.
After the first year, survival rates for startups decline sharply. Many startups begin with significant funding, which can quickly diminish by the second year, leading to financial struggles.
-
Up to 90% of startups fail by year 15.
While the average US business has a 25% chance of surviving to year 15, startups face even tougher odds, with as many as 90% failing by this milestone.
Startup Statistics by Profitability
Profitability is crucial for startups, yet not all achieve it. Many encounter overspending, inadequate marketing, and various financial hurdles. Here’s the state of profitability:
-
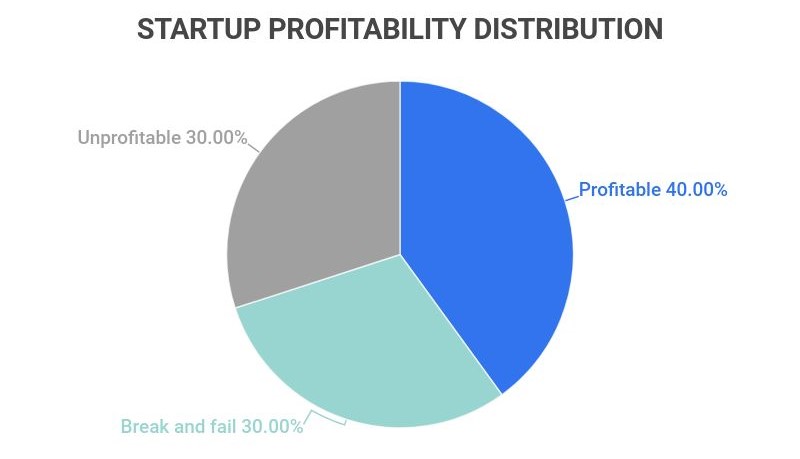
Only 35% of startups are profitable.
The remaining 65% are divided between 30% that fail to achieve profitability and 35% that either break even or go under.
Profitability Share of startups Profitable 35% Not profitable 30% Break even or fail 35% -
The global startup economy has a market cap exceeding $4 trillion.
Despite a low profitability rate, startups are part of a massive economy, often characterized by rapid growth and innovation.
-
A new startup has a 0.0001% chance of becoming a unicorn.
This increases to a 3% (one in 33) chance for venture-backed seed-stage startups, yet becoming a unicorn remains exceedingly rare.
-
70% of the top 100 unicorns are not profitable.
Unicorn status does not guarantee profitability; many of these companies are supported by substantial investor backing rather than sustainable profits.
Startup Statistics by Funding
Startup funding, often through venture capital, is vital for success. However, not every startup secures the necessary financial backing. Here are some key insights into startup funding:
-
Only 0.04% of startups successfully raise venture capital.
Of those that do, 30% achieve long-term success, compared to only 15% of startups that do not secure funding.
-
One in four startups starts with less than $5,000 in capital.
Although the average small business requires at least $10,000, a significant number of startups begin with substantially less.
-
50% of startups launch from home.
Of the approximately 34 million small businesses in the US, about 17 million start from home, reflecting a trend in entrepreneurship.
Startup Statistics by Reasons for Failure
With 90% of startups failing, various factors contribute to these outcomes. Here are significant reasons why startups falter:
-
Founders of failed startups are 25% more likely to succeed on their next attempt.
Lessons learned from previous failures often equip entrepreneurs for greater success in subsequent ventures.
-
40% of startups fail due to extended development times.
Prolonged development can drain resources without yielding returns, which can hinder a startup’s viability.
-
30% of startups fail because of a lack of product-market fit.
This issue is a leading cause of startup failure, alongside marketing missteps (25%), team dynamics (20%), and financial challenges (15%).
Reason for Failure Share of Startups Lack of product-market fit 30% Marketing problems 25% Team issues 20% Financial problems 15% Tech, operations, or legal issues 10%
Startup Statistics by Country
While the United States remains a leader in the startup ecosystem, other countries are rapidly emerging as significant players. Here are noteworthy statistics:
-
The US has over four times the number of startups compared to the next leading country.
India, with approximately 15,000 startups, ranks second but is still far behind the US’s 80,000. The US has nearly twice as many startups as the combined total of the next nine countries.
Country Number of Startups (2025) United States 80,000 India 15,000 United Kingdom 7,000 Canada 4,000 Australia 3,000 Indonesia 2,800 Germany 2,500 France 1,800 Spain 1,600 Brazil 1,300 -
San Francisco remains the top city for startups, boasting a quality score of 600.45.
This score is significantly higher than New York, which follows with a score of 240.32.
City Total Score San Francisco 600.45 New York 240.32 London 130.00 Los Angeles 120.00 Boston 115.00 Beijing 110.00 Shanghai 75.00 Bangalore 65.00 Tel Aviv 60.00 Paris 55.00 -
The United States is home to 62% of all unicorns.
The US leads the world in unicorns, with China (15%), India (5%), and the UK (3%) trailing behind.
Country Share of Unicorns United States 62% China 15% India 5% United Kingdom 3% Singapore 2% Sweden 2% Germany 1.5% Canada 1.4% South Korea 1.2% Russia 1% -
China’s ByteDance is currently the most valuable unicorn, valued at $150 billion.
This AI-driven startup leads the valuation rankings, followed by notable unicorns like SpaceX ($140 billion), SHEIN ($120 billion), and Stripe ($100 billion).
Unicorn Valuation Country of Origin ByteDance $150B China SpaceX $140B United States SHEIN $120B China Stripe $100B United States Canva $50B Australia Checkout.com $50B United Kingdom Instacart $45B United States Databricks $42B United States Revolut $38B United Kingdom Epic Games $35B United States
Startup Statistics FAQ
-
What percentage of startups are successful?
Only 10% of startups achieve long-term success. While many survive their first year, with 90% still operational, this figure drops significantly in subsequent years, particularly by the fifth year when only half remain.
Startups face the greatest challenges between their second and fifth years, where failure rates can reach up to 70%.
-
How many startups were created in 2022?
6,000 startups were founded in the US in 2022. The number of startups continues to grow, contributing to the current total of over 80,000 across the nation.
This number exceeds the combined total of startups in Australia and Indonesia, which rank fourth and fifth worldwide.
-
What is a realistic growth rate for a startup?
A realistic growth rate for a startup ranges from 15% to 45%. However, businesses that generate $2 million or more can experience growth rates as high as 180% in their first year, 100% in the second, and 75% in the third.
Rapid growth can lead to the temptation to scale prematurely, which is a common pitfall for many startups, accounting for 65% of failures.
-
What percentage of startups get acquired?
15% of Series E startups are acquired. Acquisitions typically occur after Series E, where less than 20% of startups remain operational.
-
What is the leading cause of startup failure?
Premature scaling is the leading cause of startup failure, responsible for 65% of failures. Other significant reasons include:
A lack of product-market fit (30%), marketing issues (25%), team dynamics (20%), and financial challenges (15%).
Given the significant risks, it’s essential for entrepreneurs to monitor their startups closely, even in the face of early success.
Conclusion
Building a successful startup, or even achieving unicorn status, is the aspiration of many entrepreneurs. Innovating new ideas, products, and services is not only rewarding but also embodies the entrepreneurial spirit.
However, the journey is marked by high risks and substantial failure rates. With 90% of startups ultimately failing, numerous challenges can surface within just a few years.
Don’t let these statistics deter you. Instead, leverage them to strategize effectively and navigate the startup landscape. Remember, entrepreneurs who learn from initial failures often find greater success in their subsequent ventures.
Continue to pursue your dreams with determination and thorough research, and you may turn your aspirations into reality.
References
-
Failory – Startup Failure Rate: How Many Startups Fail and Why in 2023?
-
Embroker – Checklist: How to Become a Unicorn Startup in 2023
-
TechCrunch – Unicorns Aren’t Profitable, and Wall Street Doesn’t Care
-
Small Business Trends – One-third of Small Businesses Start with Less Than $5,000
-
Forbes – 11 Surprising and Insightful Statistics About Startups
-
Statista – Leading Cities for Startups Worldwide in 2022, by Total Score
- Business Statistics
- Startup Statistics
- Cloud Adoption Statistics
- Customer Loyalty Statistics
- Nonprofit Statistics
- Affiliate Marketing Statistics
- Cart Abandonment Rate Statistics
- Ridesharing Statistics
- Call Center Statistics
- eLearning statistics
- Customer Service Statistics
- Customer Experience statistics
- Entrepreneur Statistics
- Outsourcing Statistics
- Gross Revenue for Marketing and Advertising
- Sales Statistics
- MBA Statistics
- Average Small Business Revenue + Profit Margin
- How Much Do Employee Benefits Cost?
Author
Jack Flynn is a writer for Zippia. In his professional career he’s written over 100 research papers, articles and blog posts. Some of his most popular published works include his writing about economic terms and research into job classifications. Jack received his BS from Hampshire College.