- Industry Statistics
- Wedding Industry Statistics
- Yoga Industry Statistics
- Music Industry Statistics
- Landscaping Industry Statistics
- Bicycle Industry Statistics
- Coffee Industry Statistics
- Car Rental Industry Statistics
- Home Improvement Industry Statistics
- Insurance Industry Statistics
- Supplements Industry Statistics
- Golf Industry Statistics
- Fitness Industry Statistics
- US Media And Entertainment Industry Statistics
- Firearm Industry Statistics
- Financial Services Industry Statistics
- Health And Wellness Industry Statistics
- Trucking Industry Statistics
- Wine Industry Statistics
- Pet Industry Statistics
- Mobile App Industry Statistics
- Digital Marketing Industry Statistics
- Hotel Industry Statistics
- Retail Statistics
- Robotics Industry Statistics
- Jewelry Industry Statistics
- Appointment Scheduling statistics
- Restaurant Industry Statistics
- Food Delivery Statistics
- Food Truck Industry
- Fashion Industry
- Real Estate Industry
- US Film Industry
- US Beverage Industry
- USu202fFast Food Restaurants
- US Construction Industry
- US Book Industry
- Cosmetics Industry
- US Food Retail Industry
- US Pharmaceutical Industry
- US Healthcare Industry
- Airline Industry
- Automobile Industry
- Transportation Industry Statistics
- Event Industry Statistics
- Project Management Statistics
- Oil And Gas Industry Statistics
- Nursing Home Statistics
- Nursing Shortage Statistics
- Nursing Statistics
25 Fascinating Supplements Industry Statistics [2026]: Data + Trends
Supplements Industry Research Summary. The supplements industry continues to thrive as consumer interest in health and wellness grows. With major players like GNC and a surge in advertising, the sector has become a significant part of the health market, even amidst ongoing discussions about regulation and safety.
To delve deeper into the supplements industry and identify the best-selling products, consider the following insights from our updated research:
-
77% of Americans take at least one supplement.
-
The average American spends $96.50 per trip on vitamins and supplements.
-
The U.S. vitamin & supplement manufacturing industry is valued at $43.5 billion as of 2025.
-
The global supplements industry is projected to maintain a CAGR of 6.9% through 2026.
For further analysis, we have categorized the data into the following sections:
Consumers | Trends and Projections | Types of Supplements

General Supplements Industry Statistics
Supplements have now become a fundamental part of many American households. Just how robust is the industry in 2025? Our research indicates:
-
The global dietary supplements market is worth $165.71 billion as of 2025.
A significant portion of this revenue comes from vitamins, which account for 30.8% of total sales. The ongoing trend reflects a growing interest in health-enhancing products.
-
Americans spend $30.2 billion on supplements annually.
This expenditure breaks down to $28.3 billion for adults and $1.9 billion for children, constituting approximately 9.2% of total out-of-pocket U.S. healthcare spending. With only 59 million Americans purchasing supplements, the average annual spend exceeds $500 per user.
-
The U.S. supplements industry boasts an average profit margin of 38%.
While this is significantly lower than the overall pharmaceutical profit margin of 76.5%, it remains lucrative for suppliers. Average supplement stores report earnings of over $100,000 per year.
-
There are over 29,000 different dietary supplements available to U.S. consumers.
Additionally, approximately 1,000 new supplements are introduced to the market each year.
Supplements Industry Statistics by Consumers
The supplements industry thrives on consumer demand, which drives growth and innovation. According to our latest findings:
-
77% of Americans take at least one supplement.
Specifically, 57.6% of Americans aged 20 and over have used a dietary supplement in the past month, with usage increasing significantly with age.
-
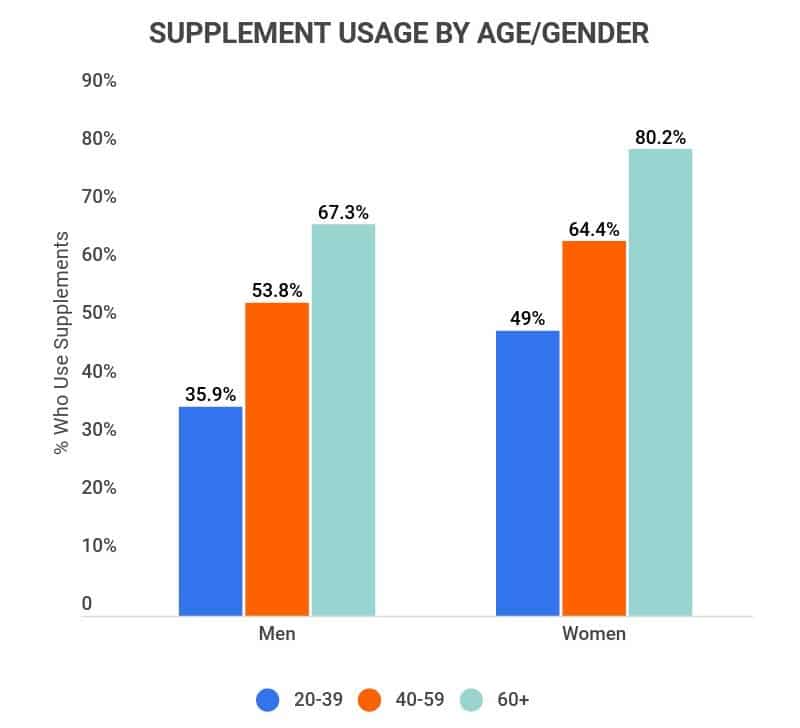
Women use supplements 25.59% more than men.
Overall, 63.8% of women and 50.8% of men use supplements, with older women (80.2% aged 60+) showing the highest usage compared to older men (67.3%).
-
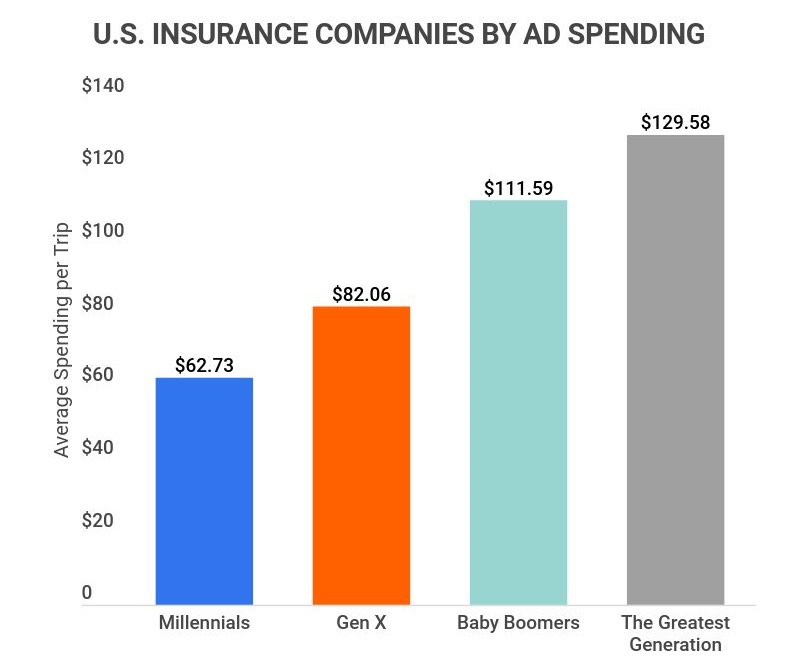
The Greatest Generation spends the most on supplements, averaging $129.58 per purchase.
Following them, Baby Boomers spend $111.59, Gen X spends $82.06, and Millennials spend $62.73.
-
74% of Americans are concerned supplements lack trustworthy research support.
Despite the fact that 40% of supplement users take them to bolster their immune systems, skepticism remains prevalent.
-
72% of consumers have confidence in herbal supplements.
Even with general distrust, consumers tend to favor natural products over those associated with the pharmaceutical industry.
Supplements Industry Statistics Trends and Projections
The popularity of supplements has surged over the years. To provide context on current trends and future directions, here are some compelling insights:
-
From 1975 to 2015, American supplement use increased by 25%.
By 2014, over half of the population reported using supplements regularly.
-
Consumer interest in vitamins such as C, D, elderberry, and echinacea spiked significantly during the pandemic.
While the U.S. supplements industry saw modest growth of 2-3% from 2015 to 2019, the pandemic accelerated this to an increase of 5-8% in 2020.
-
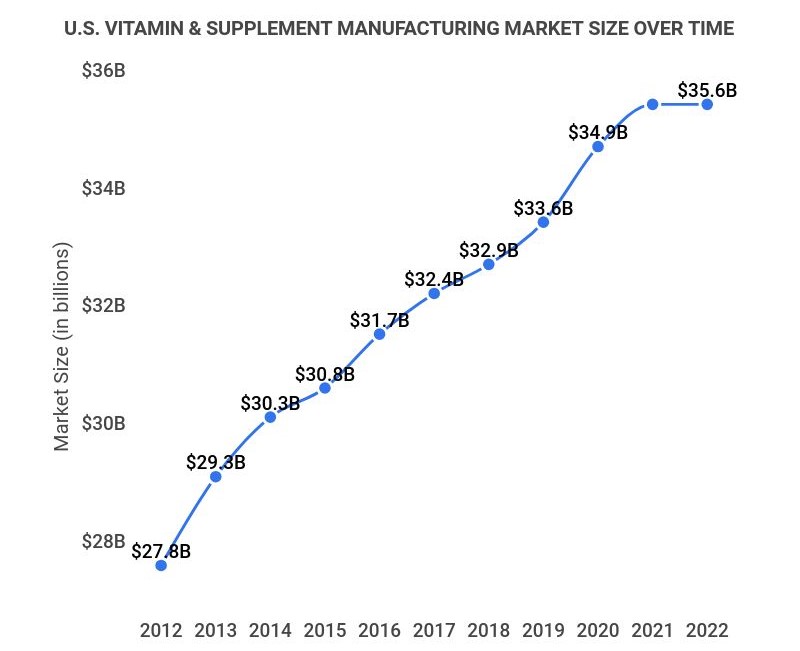
The U.S. dietary supplement market size is projected to reach $56.7 billion by 2024.
With a market size of $31.7 billion in 2016, this represents a remarkable growth trajectory of 78.9% in less than a decade.
-
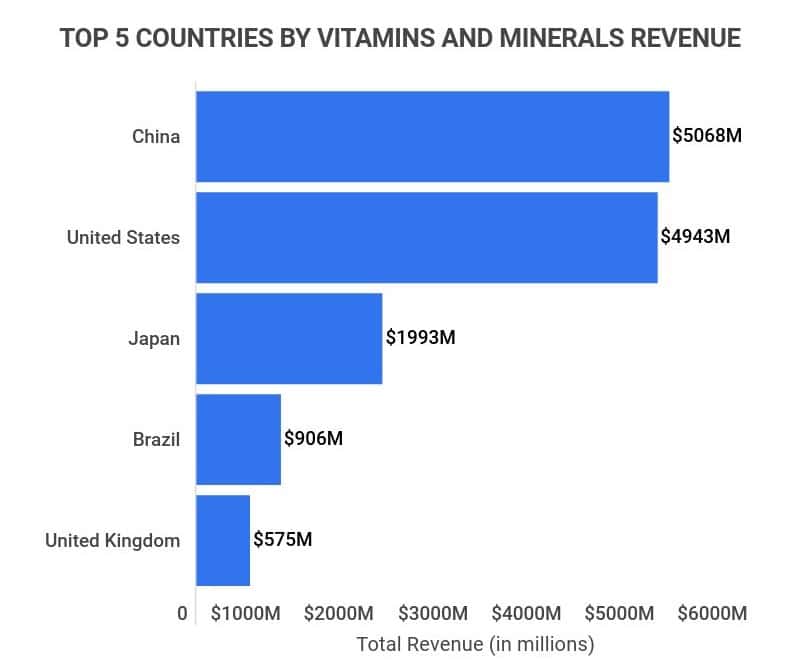
Revenue from the U.S. vitamins and minerals market is expected to reach $4.06 billion in 2023.
The U.S. ranks second globally, following China ($5.07 billion), with Japan ($1.99 billion), Brazil ($906 million), and the UK ($575 million) trailing behind.
-
The global beauty supplement market is projected to grow at an impressive CAGR of 9.5% through 2026.
This sector, while smaller, is rapidly expanding, expected to rise from $4.12 billion in 2017 to $9.3 billion by 2026.
Supplements Industry Statistics by Types of Supplements
From enhancing athletic performance to promoting skin health, supplements cater to various needs. Here are key insights into different supplement types:
-
Americans spend an average of $2.1 billion annually on weight loss supplements.
-
15% of U.S. adults have tried weight loss supplements (21% women, 10% men).
-
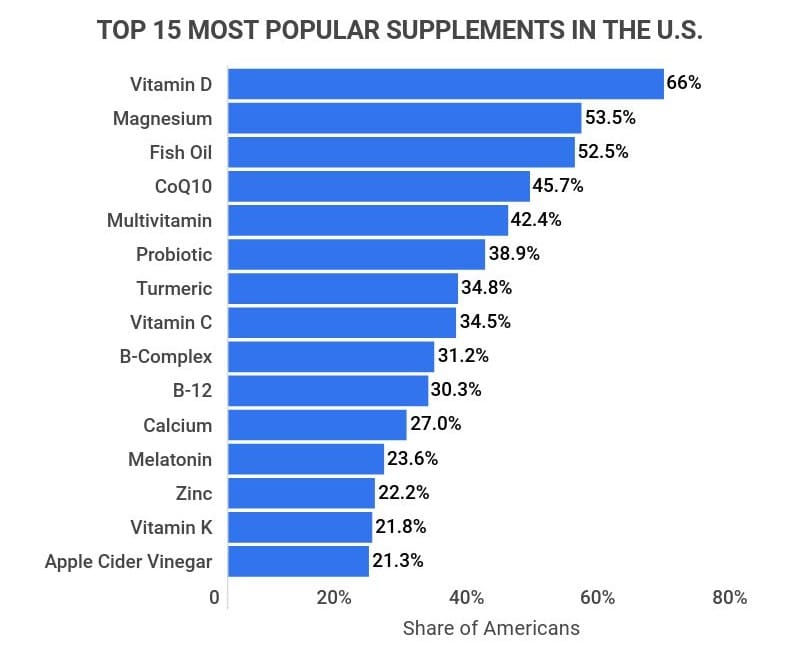
The most popular supplement in the U.S. is Vitamin D, purchased by 66% of consumers.
-
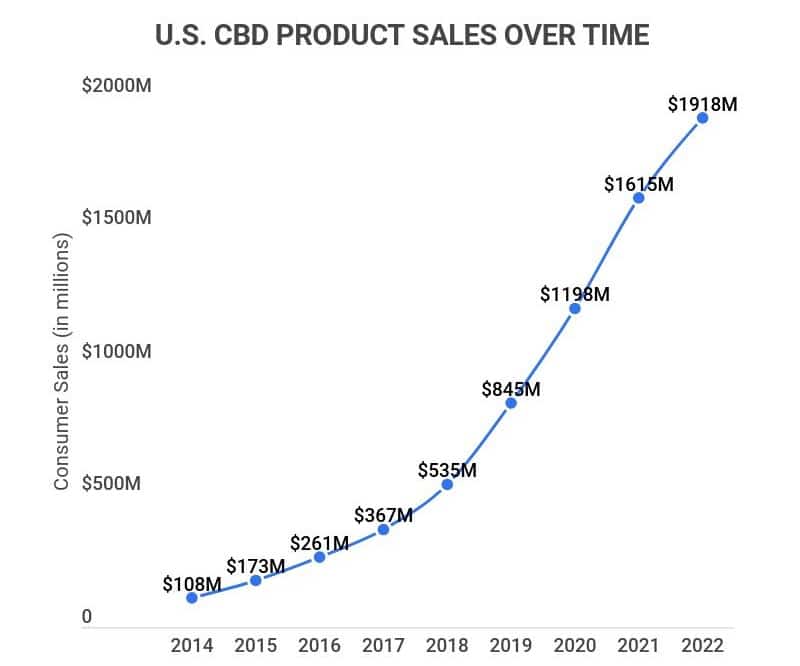
Between 2017 and 2022, CBD supplement sales surged by 422% (from $367 million to $1.92 billion).
-
5.7% of college athletes take caffeinated multivitamins, while 41.7% use protein supplements.
-
25% of U.S. adults mix dietary supplements with prescription medications.
-
112.5% more women take iron supplements than men (17% of women vs. 8% of men).
Supplements Industry Statistics FAQ
-
How much is the U.S. supplements industry worth?
The U.S. Vitamin & Supplement Manufacturing industry is valued at $43.5 billion. Overall, the U.S. supplement industry is the second largest globally, with a projected revenue of $4.06 billion in 2023.
Additionally, 77% of Americans now take at least one supplement, making them prevalent across various demographics.
-
Is the supplements industry growing?
Yes, the U.S. supplements industry is expanding. Between 1975 and 2015, American supplement use increased by 25%, with over half the population using supplements by 2014. This upward trend is expected to continue:
-
The U.S. dietary supplement market is projected to grow by 78.9% in under ten years, reaching $56.7 billion by 2024.
-
The global supplements industry anticipates a CAGR of 6.9% from 2021 to 2026.
-
The global beauty supplement market is forecasted to grow at a CAGR of 9.5% through 2026.
These examples illustrate the rapid expansion across nearly all supplement categories.
-
-
How much do Americans spend on supplements?
The average American spends $96.50 per trip on vitamins and supplements. Spending varies significantly by age, with older Americans generally spending more.
The Greatest Generation spends the most on supplements, averaging $129.58 per purchase, followed by Baby Boomers at $111.59, Gen X at $82.06, and Millennials at $62.73.
-
Is the supplements industry regulated?
Yes and no. Dietary supplements are regulated by the FDA and FTC under the Dietary Supplement Health and Education Act of 1994 (DSHEA). This requires consumers to have access to crucial information about ingredients, warnings, and recalls.
However, 74% of Americans express concern that supplements lack trustworthy research, which may stem from the limited regulatory oversight.
-
How many supplements companies are there in the U.S.?
There are approximately 450 major supplement companies in the U.S. Notable brands include Nature Made, Kirkland Signature, Klean Athlete, Life Extension, and Amazon Elements. These companies distribute products through around 15,070 health supplement stores nationwide.
-
How many supplements are on the market?
Over 29,000 different dietary supplements are available to U.S. consumers. Furthermore, approximately 1,000 new supplements are introduced to the market each year, which is particularly noteworthy given that fewer than 500 companies manufacture these products in the U.S.
-
What are the top 3 supplements sold?
The top three supplements sold in the U.S. are multivitamins, vitamin D, and omega-3s. These supplements are primarily linked to various health benefits, with multivitamins used for overall health, vitamin D for mood and bone health, and omega-3s for heart and brain health.
Conclusion
The U.S. supplements market, now valued at $43.5 billion, and the global market at $165.71 billion, demonstrates significant growth and consumer engagement. As of 2025, 77% of Americans reportedly consume at least one supplement, with older demographics showing even higher usage rates. Annually, Americans collectively spend $30.2 billion on these products.
Overall, the U.S. supplements industry is set to continue its impressive trajectory, expected to achieve a CAGR of up to 8% and reach $56.7 billion by 2024. The evolving landscape of health and wellness reinforces the ongoing relevance and demand for dietary supplements.
Sources:
-
Statista. “Average spend per trip on vitamins and supplements of consumers in the United States in 2019, by generation.” Accessed on April 6th, 2022.
-
IBISWorld. “Vitamin & Supplement Manufacturing in the US – Market Size 2005–2027.” Accessed on April 6th, 2022.
-
Grand View Research. “Dietary Supplements Market Size, Share & Trends Analysis Report By Ingredient (Vitamins, Minerals), By Form, By Application, By End User, By Distribution Channel, By Region, And Segment Forecasts, 2022 – 2030.” Accessed on April 7th, 2022.
-
NIH. “Americans Spend $30 Billion a Year Out-of-Pocket on Complementary Health Approaches.” Accessed on April 7th, 2022.
-
TRUiC. “How To Open a Supplement Store.” Accessed on April 7th, 2022.
-
NCBI. “Dietary Supplements: A Framework for Evaluating Safety.” Accessed on April 7th, 2022.
-
CDC. “Dietary Supplement Use Among Adults: United States, 2017–2018.” Accessed on April 7th, 2022.
-
PRN. “New Survey Reveals 74 Percent of Americans are Concerned that Vitamins and Supplements are not Backed by Trustworthy Research.” Accessed on April 7th, 2022.
-
SpringerLink. “Physically inactive adults are the main users of sports dietary supplements in the capital of Brazil.” Accessed on April 7th, 2022.
-
LEK. “Impact of COVID-19 on Vitamins, Minerals and Supplements.” Accessed on April 7th, 2022.
-
Statista. “Total U.S. dietary supplements market size from 2016 to 2024.” Accessed on April 7th, 2022.
-
Statista. “Revenue of the leading global markets for vitamins and minerals in 2022, by country.” Accessed on April 7th, 2022.
-
NIH. “Dietary Supplements for Weight Loss.” Accessed on April 7th, 2022.
-
ConsumerLab. “Collagen and Magnesium Rise in Popularity, as Fish Oil and Curcumin Dip in Latest ConsumerLab Survey of Supplement Users.” Accessed on April 7th, 2022.
-
Statista. “Total U.S. cannabidiol (CBD) product sales from 2014 to 2022.” Accessed on April 7th, 2022.
-
American Family Physician. “Common Herbal Dietary Supplement–Drug Interactions.” Accessed on April 7th, 2022.
- Industry Statistics
- Wedding Industry Statistics
- Yoga Industry Statistics
- Music Industry Statistics
- Landscaping Industry Statistics
- Bicycle Industry Statistics
- Coffee Industry Statistics
- Car Rental Industry Statistics
- Home Improvement Industry Statistics
- Insurance Industry Statistics
- Supplements Industry Statistics
- Golf Industry Statistics
- Fitness Industry Statistics
- US Media And Entertainment Industry Statistics
- Firearm Industry Statistics
- Financial Services Industry Statistics
- Health And Wellness Industry Statistics
- Trucking Industry Statistics
- Wine Industry Statistics
- Pet Industry Statistics
- Mobile App Industry Statistics
- Digital Marketing Industry Statistics
- Hotel Industry Statistics
- Retail Statistics
- Robotics Industry Statistics
- Jewelry Industry Statistics
- Appointment Scheduling statistics
- Restaurant Industry Statistics
- Food Delivery Statistics
- Food Truck Industry
- Fashion Industry
- Real Estate Industry
- US Film Industry
- US Beverage Industry
- USu202fFast Food Restaurants
- US Construction Industry
- US Book Industry
- Cosmetics Industry
- US Food Retail Industry
- US Pharmaceutical Industry
- US Healthcare Industry
- Airline Industry
- Automobile Industry
- Transportation Industry Statistics
- Event Industry Statistics
- Project Management Statistics
- Oil And Gas Industry Statistics
- Nursing Home Statistics
- Nursing Shortage Statistics
- Nursing Statistics
Author
Jack Flynn is a writer for Zippia. In his professional career he’s written over 100 research papers, articles and blog posts. Some of his most popular published works include his writing about economic terms and research into job classifications. Jack received his BS from Hampshire College.