- Income Statistics
- Average PTO Days
- What Percentage of Americans Live Paycheck to Paycheck?
- Average American Income
- Millionaire Statistics
- Average Salary out of College
- Average Bonus Statistics
- Minimum Wage Statistics
- Union Benefits Statistics
- Savings Statistics
- Average Annual Raise
- Income Inequality Statistics
- How Many People Make Over 100k?
- Average 401(k) Sstatistics
- Average Net Worth Statistics
- $100k After-Tax Income By State
- Average Global Income
29 Worthwhile Union Statistics [2026]: Membership, Union vs. Non-Union Jobs, and Key Facts
Research Summary. Unions continue to play a critical role in the American labor landscape, serving as a collective voice for workers aiming to protect their rights and advance their interests. Understanding the differences between union and non-union jobs is essential for today’s workforce. Based on our extensive research, here are some vital statistics about unions in the U.S. as of 2026:
-
As of 2023, only 10.8% of American workers are union members.
-
Union members earn a median weekly wage of $1,189, compared to $1,034 for non-union members.
-
There are approximately 14.5 million union members in both private and public sectors across the U.S.
-
From 1983 to 2023, union membership in the U.S. has decreased by 36%.
-
Hawaii has the highest union membership at 21.5%, whereas South Carolina has the lowest at 1.9%.
For a deeper analysis, we organized the data into the following categories:
Demographics | Industry | Region | Top Benefits | Public Opinion | Trends
Union Membership Statistics by Demographics
Membership in unions spans across genders and ethnic groups, but representation varies significantly. Here are key demographic insights:
-
Only 6.4% of private sector workers are unionized.
This number is notably lower than the public sector, where union membership is much more prevalent.
-
Black Americans hold the highest unionization rate at 12.1%.
In comparison, 10.5% of White Americans, 9.2% of Asian Americans, and 9.4% of Hispanic Americans belong to a union.
Percent of Workers Who Belong to a Union By Race
Race % of workers who belong to a union White 10.5% Hispanic or Latino 9.4% Black 12.1% Asian 9.2% -
Women are about 38% more likely than men to be union members.
As of 2023, 28% of women are union members compared to only 20.3% of men. This statistic highlights the ongoing shifts in labor demographics.
Union Membership Statistics by Industry
The industry you work in significantly influences your likelihood of union membership. Public sector jobs typically have the highest rates, but other sectors also show notable numbers. For instance:
-
The Utilities sector has the highest unionization rate, with 21.2% of workers being union members.
Other industries with a high percentage of union members include: Transportation (17.0%), Telecommunications (15.8%), Educational Services (14.5%), and Construction (13.2%).
Highest Percent of Union Workers By Industry
Industry % of workers who belong to a union Public Sector 34.2% Utilities 21.2% Transportation 17.0% Telecommunications 15.8% Educational Services 14.5% -
The Financial Activities sector has the lowest union membership at 2.1%.
Many industries with a high percentage of private sector workers report low union representation.
Other sectors with low union membership include: Leisure and Hospitality (2.3%), Wholesale & Retail Trade (4.1%), Mining, Quarrying & Oil & Gas Extraction (5.1%), and Manufacturing (8.9%).
Lowest Percent of Union Workers By Industry
Industry % of workers who belong to a union Financial Activities 2.1% Leisure and Hospitality 2.3% Wholesale & Retail Trade 4.1% Mining, Quarrying & Oil & Gas Extraction 5.1% Manufacturing 8.9% -
Comparatively, Iceland remains the leader in union membership globally, with a rate of 91.8%.
In contrast, the U.S. continues to report low rates of union membership among its workforce.
Percent of Workers Who Belong to a Union by Country
Country % of workers who belong to a union Iceland 91.8% Denmark 68.0% Sweden 66.1% Finland 59.5% Norway 51.2% Vietnam 50.2% Belgium 49.5% Kazakhstan 47.0% China 45.8% Malta 43.1%
Union Membership Statistics by Region
The distribution of union membership varies significantly across U.S. states. Our research indicates:
-
Hawaii leads with a union membership rate of 21.5%.
Other states with high union membership include: New York (20.7%), Washington (18.5%), Oregon (16.0%), and New Jersey (15.8%).
Highest Percent of Union Workers By State
State % of workers who belong to a union Hawaii 21.5% New York 20.7% Washington 18.5% Oregon 16.0% New Jersey 15.8% -
South Carolina has the lowest union membership at 1.9%.
South Carolina stands out as the most anti-union state, with others like North Carolina, Utah, and South Dakota reporting less than 4% union membership.
Lowest Percent of Union Workers By State
State % of workers who belong to a union South Carolina 1.9% North Carolina 2.8% South Dakota 3.1% Utah 3.7%
Union Membership Statistics by Top Benefits
Many workers join unions for the protections and benefits offered. Here are the most notable advantages:
-
Union workers earn 12.5% more than their non-union counterparts.
If a non-union worker makes $50,000 annually, a union member in a similar role would earn approximately $56,250.
-
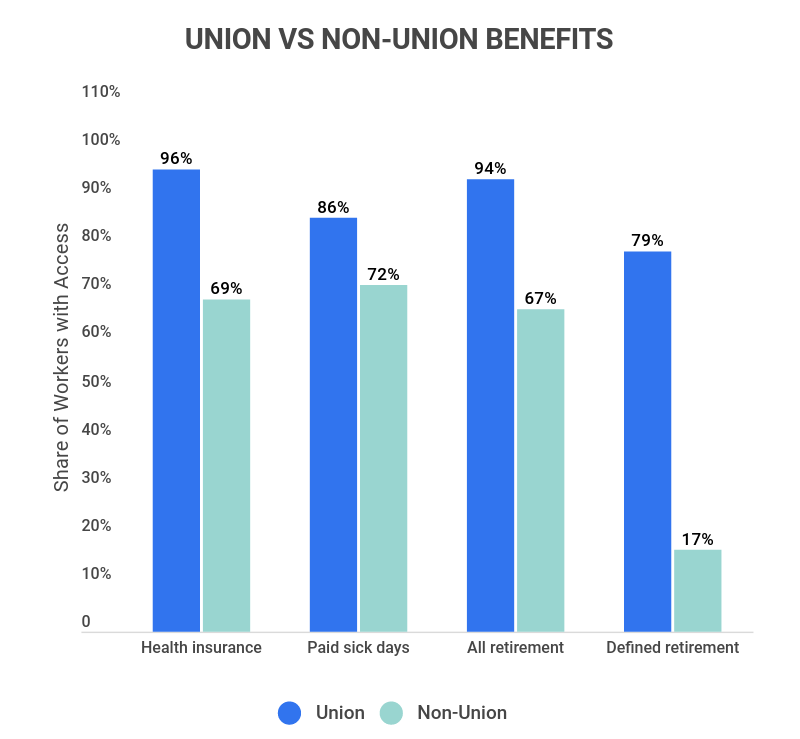
Union members are 40% more likely to have health insurance.
While 70% of non-union employees receive health insurance from their employer, a staggering 97% of union members do. Union members also enjoy paid sick leave, at a rate of 88% versus 74% for non-union workers.
-
Union workers are 38 times more likely to have access to a defined retirement plan.
About 80% of union members have access to defined retirement plans, compared to just 18% of non-union workers.
-
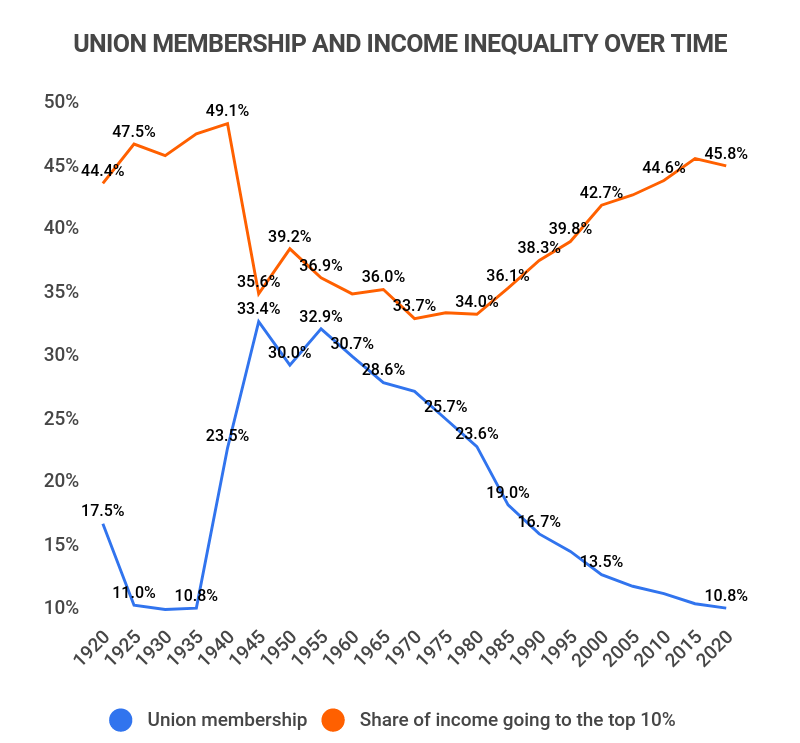
When union membership peaked in 1945, income inequality was 22% lower.
This correlation suggests that higher union membership rates contribute to reduced wealth concentration among the top earners.
Union Statistics by Public Opinion
Americans have diverse opinions about unions. Here are some insights into public sentiment:
-
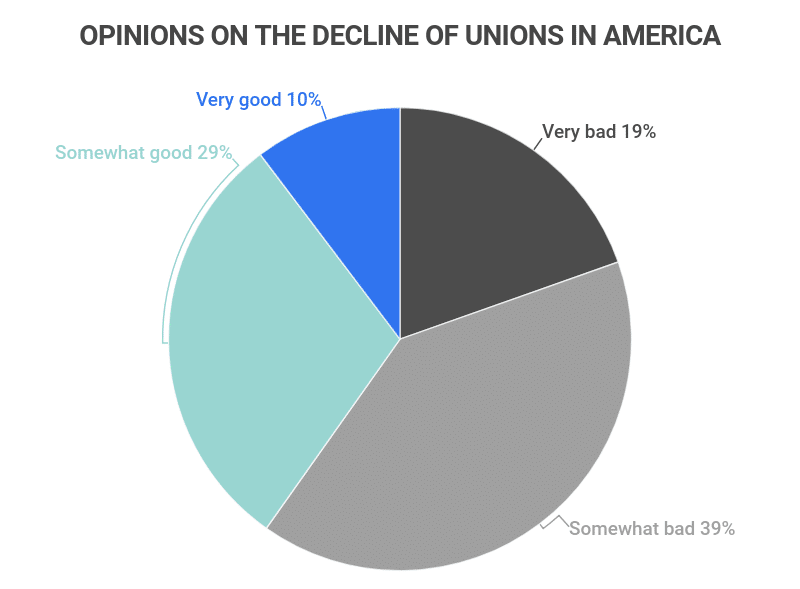
60% of Americans believe declining union membership is detrimental to the U.S.
-
55% of U.S. Republicans see the decline of unions positively, while 45% view it negatively.
-
75% of U.S. Democrats perceive the decline of unions negatively, with only 25% viewing it positively.
-
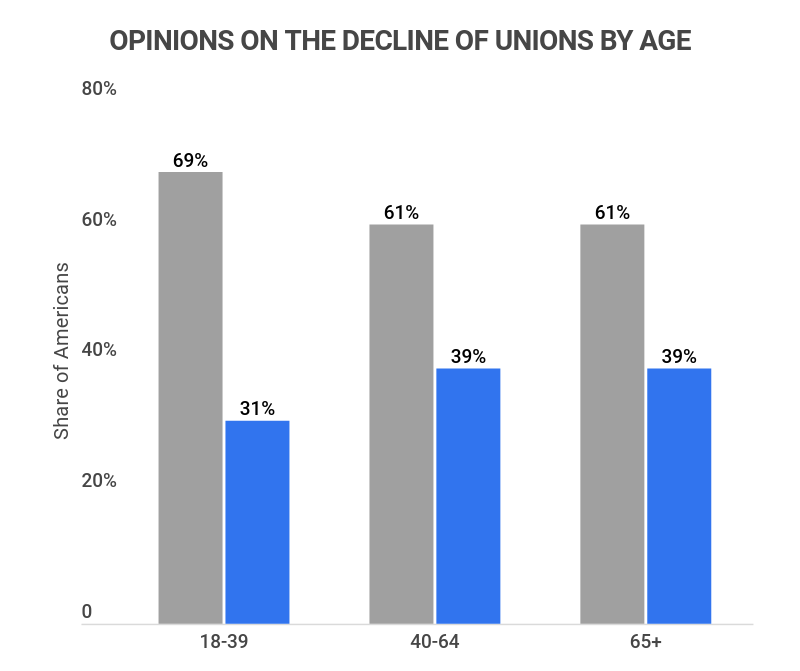
68% of Americans aged 18-39 feel that the decline in unions is harmful, while 63% of those aged 40-64 and 64% of those aged 65+ share the same view.
-
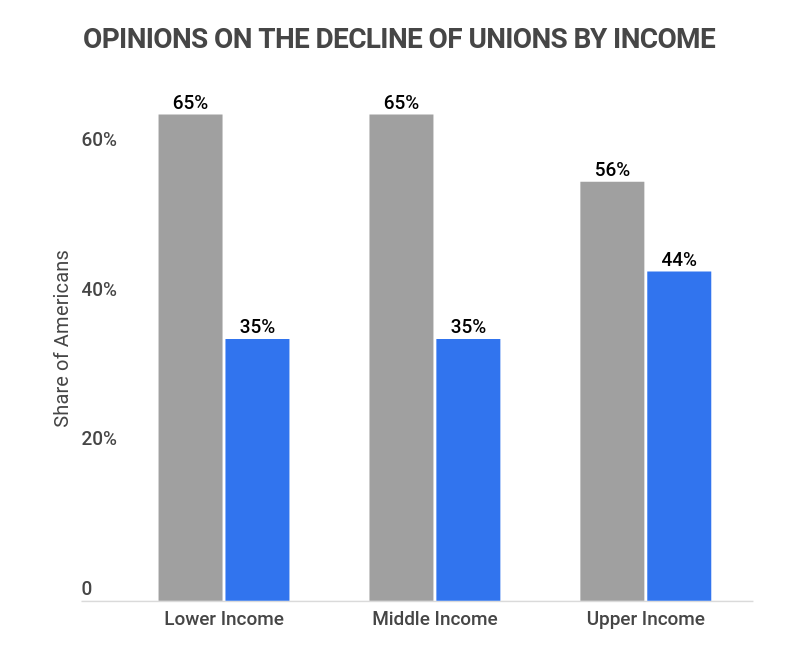
67% of individuals with lower and middle incomes agree that the decline in unions is a negative trend, compared to 58% of upper-income individuals.
-
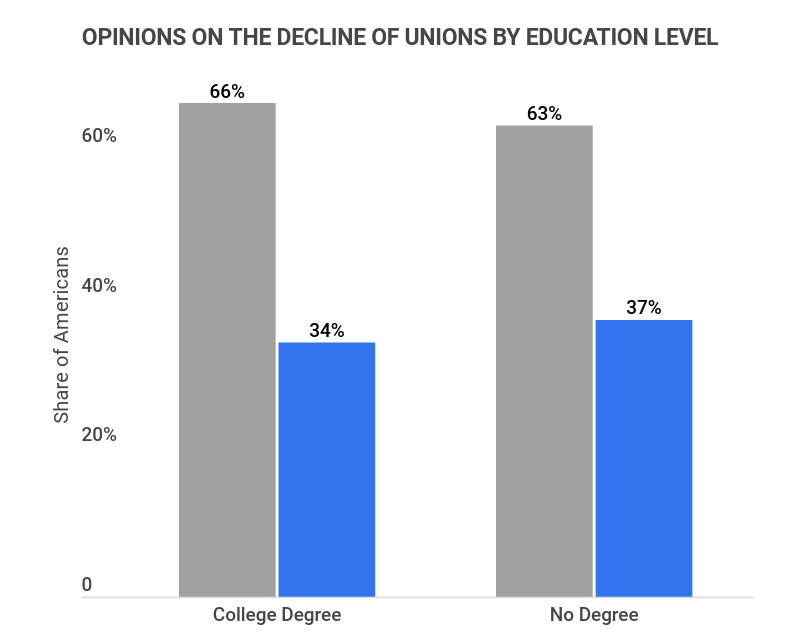
70% of college-educated individuals believe the decline in unions has been negative, while 63% of those without degrees agree.
-
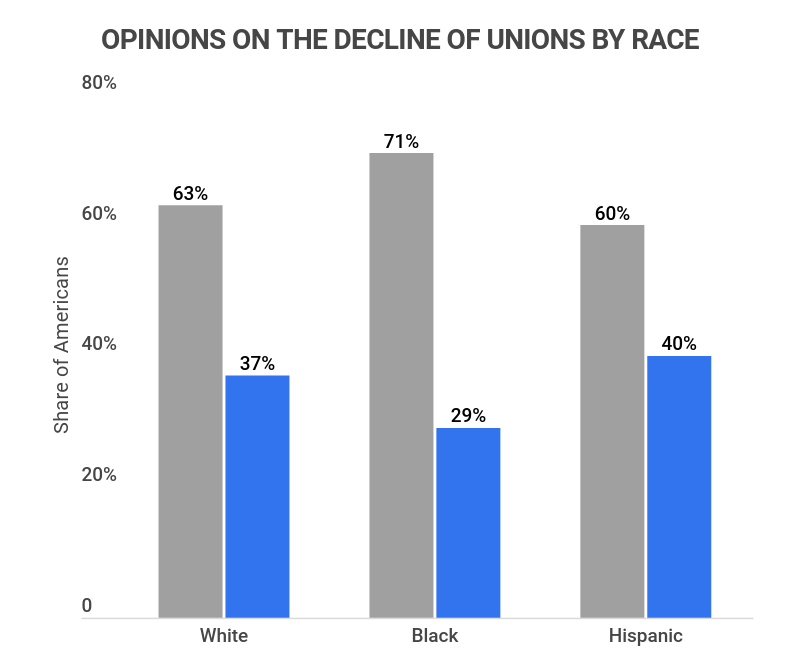
Black Americans view the decline in unions most negatively, with 73% agreeing it has been a detrimental trend.
Union Membership Trends
Although union membership has been on the decline for years, recent trends show that interest is revitalizing, particularly among younger generations. Our findings reveal:
-
Union membership increased by 8.6% between 2021 and 2023.
Following a historic low in 2020, union membership has seen a gradual rise, reaching 10.8% in 2023.
-
The peak of union membership occurred during the 1940s, specifically in 1945, at 33.4%.
This period marked a significant reduction in income inequality, illustrating the influence of unions on economic disparity.
-
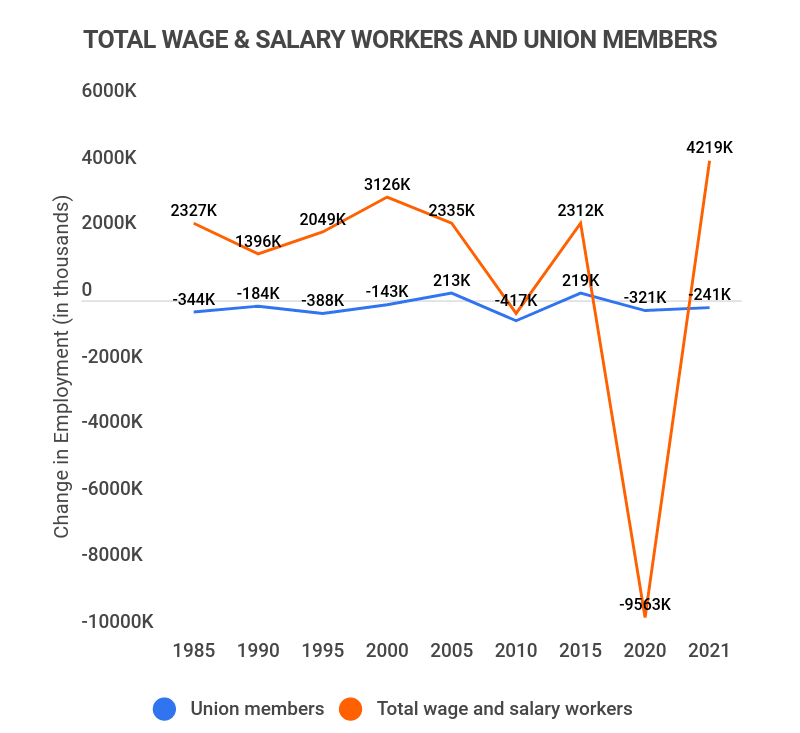
2020’s labor force saw a decrease of 9.5 million wage and salary workers, while only 320,000 were union workers.
This statistic highlights the enhanced protection unions provide during economic downturns.
-
From 2021 to 2023, union membership among Asian Americans declined by 12.8%.
Asian American union membership dropped from 8.5% to 7.4%, indicating trends in union representation across demographics.
Percent of Union Membership between 2021-2023
Race 2021 2022 2023 White 10.6% 10.9% 10.8% Hispanic or Latino 9.5% 9.9% 9.4% Black 11.5% 12.2% 12.1% Asian 8.5% 8.2% 7.4% -
Men are 6% more likely than women to be union members.
As of 2023, 10.8% of men are union members compared to 10.2% of women.
Union Statistics FAQ
-
What percentage of Americans are represented by a union?
Approximately 10.8% of Americans are represented by a union as of 2023. This figure reflects a modest increase compared to previous years, but still marks a historically low point for union representation in the U.S.
For example, during the peak of union membership in 1945, at least 33.4% of the total U.S. workforce were union members. This indicates a decline of over 65% in union membership in less than a century.
-
Is union membership increasing or decreasing?
Union membership is experiencing a slight upward trend. While the overall numbers are still low compared to historical highs, recent years have shown growth, particularly amidst changing labor dynamics.
-
What are the benefits of a union?
The main benefits of union membership include enhanced protections and benefits. Union members are 40% more likely to have health insurance, 38 times more likely to have access to defined retirement plans, and earn an average of 12.5% more than their non-union counterparts.
Additionally, union membership often provides stronger legal protections against unjust termination.
-
Why do companies dislike unions?
Companies often view unions as a challenge to their control over labor costs. Unions can limit a company’s flexibility in wage negotiations and operational decisions, which can be perceived as a barrier to maximizing profits.
This tension is why many corporations oppose unionization efforts.
Conclusion
Unions remain vital in advocating for workers’ rights and benefits, yet membership has significantly declined over the years. Today, union membership is approximately 65% lower than in 1945.
Despite this decline, union members enjoy substantial advantages, including greater job security, higher wages, and better access to health care. Recent trends indicate a potential resurgence in interest, particularly among younger generations.
References:
-
BLS. “Union Members — 2023.” Accessed on February 12th, 2026.
-
BLS. “A look at union membership rates across industries in 2023.” Accessed on July 13th, 2026.
-
ILO. “Statistics on union membership.” Accessed on July 13th, 2026.
-
ALF-CIO. “Union Facts: The Value of Collective Voice.” Accessed on July 14th, 2026.
-
BLS. “Union workers more likely than nonunion workers to have retirement benefits in 2023.” Accessed on July 13th, 2026.
-
EPI. “Unions help reduce disparities and strengthen our democracy.” Accessed on July 13th, 2026.
-
Pew Research Center. “Majorities of adults see decline of union membership as bad for the U.S. and working people.” Accessed on July 13th, 2026.
-
BLS. “Union membership rate declines in 2023, returns to 2021 rate of 10.8 percent.” Accessed on July 13th, 2026.
- Income Statistics
- Average PTO Days
- What Percentage of Americans Live Paycheck to Paycheck?
- Average American Income
- Millionaire Statistics
- Average Salary out of College
- Average Bonus Statistics
- Minimum Wage Statistics
- Union Benefits Statistics
- Savings Statistics
- Average Annual Raise
- Income Inequality Statistics
- How Many People Make Over 100k?
- Average 401(k) Sstatistics
- Average Net Worth Statistics
- $100k After-Tax Income By State
- Average Global Income
Author
Jack Flynn is a writer for Zippia. In his professional career he’s written over 100 research papers, articles and blog posts. Some of his most popular published works include his writing about economic terms and research into job classifications. Jack received his BS from Hampshire College.