25+ Useful User Experience Statistics [2026]: What Is The Value Of UX?
Research Summary. In the rapidly evolving digital landscape, user experience (UX) has become a vital element of brand success. A positive user experience encourages customer loyalty, while a negative one can lead to substantial losses. Our updated research highlights key statistics regarding user experience in 2026:
-
88% of online shoppers will not return to a website after a poor user experience.
-
55% of companies perform regular user experience testing.
-
For every dollar invested in enhancing UX, businesses can expect a return of $100. (a 9,900% ROI)
-
Improving UX design can boost a website’s conversion rates by up to 200%.
-
38% of users will disengage from a poorly designed mobile app or website.
-
85% of consumers believe that a company’s mobile website should be at least as effective as its desktop version, if not better.
For further insights, we have categorized the data into the following sections:
Companies | User Opinions | Poor UX | Good UX | Mobile

UX Statistics by Online Companies
In 2026, online businesses are facing fierce competition, making exceptional user experience essential for differentiation. Our findings reveal that:
-
70% of online businesses fail due to poor usability.
Nearly three-quarters of all online businesses fail because of inadequate UX, underscoring its critical importance. Online consumers have countless options, so superior UX is essential for maintaining competitiveness and fostering customer loyalty.
-
Slow-loading websites cost businesses $6.8 billion annually.
Slow-loading sites result in lost revenue as they deter potential customers. Research shows that conversion rates drop by 4.42% for each additional second of load time beyond three seconds.
-
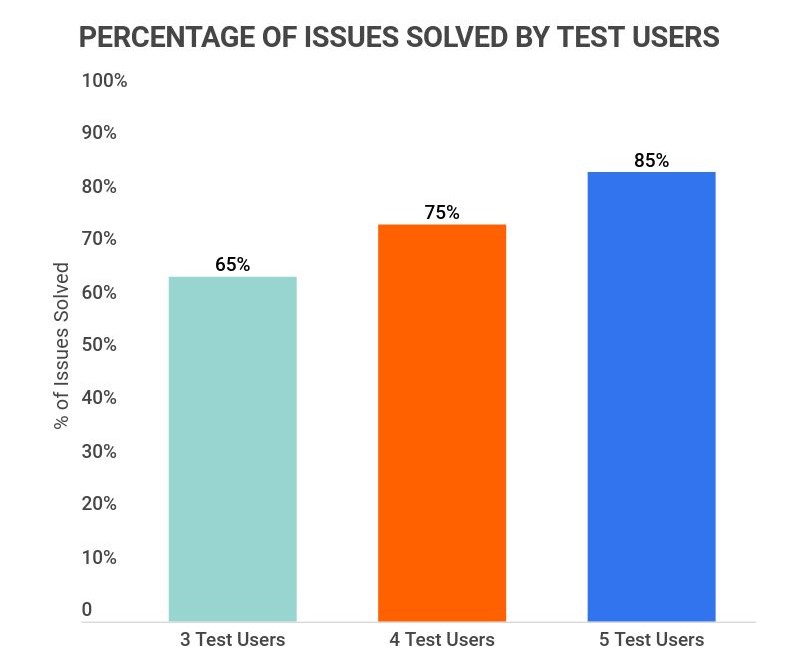
85% of issues can be identified by testing just five users.
It doesn’t take a large group to uncover usability issues. Four users can reveal up to 75% of problems, while three can still identify around 65%.
User Experience Statistics by Mobile Experience
As mobile internet usage continues to grow, providing an excellent mobile UX is more crucial than ever. Here are key statistics about mobile user experience:
-
Up to 80% of mobile users will abandon a website that doesn’t display correctly on their device.
More specifically, 53% of mobile users will leave a website that fails to load properly after just three seconds. This highlights the necessity of mobile optimization for retaining traffic.
-
Users are five times more likely to leave a website that isn’t mobile-optimized.
Poor optimization includes sites that are hard to navigate, have slow loading times, and hinder user action. These issues often arise when mobile usability is not prioritized.
-
52% of users are less likely to engage with a company that lacks a responsive mobile design.
Given that over half of all U.S. internet traffic now originates from mobile devices, a non-responsive site could cost you a significant portion of your potential customer base.

UX Statistics by User Opinions
Understanding user opinions is essential for crafting an effective user experience. Here are some noteworthy statistics regarding user perspectives:
-
52% of users claim that a poor mobile experience diminishes their trust in a company.
-
94% of first impressions are influenced by a website’s design.
-
85% of users expect a mobile experience that rivals their desktop experience.
-
A negative mobile experience frustrates 48% of users.
-
96% of customers believe that excellent customer service is crucial for brand loyalty.
-
50% of consumers feel that a company’s website is fundamental to their overall brand success.
UX Statistics by Poor User Experience
A negative user experience can severely impact a brand’s reputation and customer retention. Here’s how detrimental poor UX can be:
-
Following a poor user experience, up to 89% of users may switch to a competitor’s website.
Users typically take less than 15 seconds to decide whether to stay on a site, so capturing their attention quickly is critical.
-
38% of users will disengage if a website’s content or layout is unappealing.
An outdated or unattractive layout fails to create a positive user experience, leading to customer attrition.
-
39% of users will stop engaging if a website takes too long to load.
Research indicates that 53% of visitors will abandon a site that takes longer than three seconds to load.
-
32% of customers will cease doing business with a brand they previously loved after just one bad experience.
In detail, 17% of U.S. customers will stop engaging with a favored brand after a single negative encounter, while 59% will walk away after multiple bad experiences.
-
52% of users will not return to an app with poor aesthetics.
This can vary by individual user, making it essential to gather feedback on app design through surveys or professional consultations.
-
70% of users abandon shopping carts due to poor UX.
While cart abandonment is common, a poor UX can cause nearly three-quarters of users to leave their carts behind.
User Experience Statistics by Good User Experience
A positive user experience is crucial for encouraging customer loyalty and boosting sales. Here are key statistics illustrating the benefits of good UX:
-
74% of businesses acknowledge that user experience is essential for increasing sales.
Good UX not only leads to significant ROI but can also enhance sales by as much as 30%. The value of investing in UX is widely recognized.
-
23% of individuals who experience a positive UX share their experience with ten or more people.
Conversely, 13% of users will inform 15 or more people about a negative UX, emphasizing the importance of maintaining high standards.
-
Bounce rates can decrease by as much as 15% after websites implement a continuous scroll format.
This design choice keeps users engaged, similar to how popular social media platforms like Facebook and Instagram operate.
User Experience Statistics FAQ
-
How do you measure user experience?
There are numerous effective methods to measure user experience. Here’s a brief overview of some of the most impactful metrics:
-
Average Time on Task. This key performance indicator (KPI) measures how long users take to complete a task; generally, faster completion indicates better UX.
-
Error Occurrence Rate. This measure identifies common user errors, allowing for targeted optimization of your software.
-
Adoption Rate. This metric tracks user growth over time, particularly useful for assessing the impact of new features.
-
Retention Rate. This measurement reveals the percentage of users who continue using a product over time, helping to gauge long-term satisfaction.
-
Net Promoter Score. Known as NPS, this score reflects how likely users are to recommend a product, rated on a scale from one to ten.
-
Customer Satisfaction. Often referred to as CSAT, this metric assesses customer satisfaction on a scale of 1-100, easily quantifiable into a percentage.
-
System Usability Scale. Also known as SUS, this metric uses questionnaires to gather user feedback on their experience.
-
-
What are the main elements of a user’s experience?
Five key elements contribute to a good UX. These include:
-
Well-organized Information Architecture. This aspect focuses on optimizing software to improve usability and findability, enabling users to easily locate information and complete tasks.
-
Interaction-Oriented Design. This element emphasizes understanding user behavior to create better interactive and personalized experiences.
-
Usability-Aligned Design. This principle concentrates on ensuring that users can achieve their goals without confusion.
-
Visually Appealing Design. Aesthetic appeal enhances UX by making a site appear professional, attractive, and user-friendly.
-
Planned User Research. This strategy uses user research to create the best possible UX.
-
-
What’s the difference between UX and UI?
UX stands for user experience, while UI refers to user interface. UI comprises the elements that allow interaction with products and services, whereas UX encompasses the overall experience derived from those interactions.
For instance, a gaming app might feature a stunning and user-friendly UI, but if the game itself is poor, the overall UX will still be negative.
-
What’s the most important part of UX design?
Understanding the users is paramount in UX design. Successful UX design is rooted in thorough user research to ascertain customer needs and preferences.
Conclusion
User Experience (UX) is a fundamental component of creating and sustaining a successful digital presence, whether it be a website, app, product, or service. The evidence is clear: for every dollar invested in quality UX, businesses can see a remarkable return of $100 (a 9,900% ROI), and improved UX design has the potential to increase conversion rates by as much as 200%.
Given these insights, it’s evident that investing in UX is not just beneficial but essential. With the right knowledge, user research, and intuitive design, achieving an exceptional UX is more accessible than ever.
Sources:
-
Forbes. “How UX Is Transforming Business (Whether You Want It To Or Not).” Accessed on April 28th, 2022.
-
Medium. “7 findings that prove the importance of great UX.” Accessed on April 28th, 2022.
-
Entando. “4 UX Stats & What They Mean For You.” Accessed on April 28th, 2022.
-
Transaction. “$6.8 Billion Dollars Are Lost Annually as a Result of Slow-Loading Website.” Accessed on April 28th, 2022.
-
Invision. “Why 5 is the magic number for UX usability testing.” Accessed on April 28th, 2022.
-
CXL. “First Impressions Matter: Why Great Visual Design Is Essential.” Accessed on April 28th, 2022.
-
Gartner. “Key Findings From the Gartner Customer Experience Survey.” Accessed on April 28th, 2022.
-
HubSpot. “16 Types of Customer Needs (and How to Solve for Them).” Accessed on April 28th, 2022.
-
OpenWeb. “The 15 Second Rule: What’s Making Your Visitors Leave?” Accessed on April 28th, 2022.
-
Transaction. “38% of people will leave a website if they find the layout unattractive.” Accessed on April 28th, 2022.
-
Transaction. “39% of People Will Stop Engaging With a Website if Images Won’t Load or Take Too Long to Load.” Accessed on April 28th, 2022.
-
PWC. “Experience is everything: Here’s how to get it right.” Accessed on April 28th, 2022.
-
RedSignal. “72% of the Customers Abandon Shopping Cart Sales Due to Bad User Experience.” Accessed on April 28th, 2022.
-
TheGrowthHub. “Increase Your Sales by 30%: Why User Experience Is Crucial.” Accessed on April 29th, 2022.
-
Poynter. “Time.com’s bounce rate down 15 percentage points since adopting continuous scroll.” Accessed on April 29th, 2022.
-
MarketingDive. “Google: 53% of mobile users abandon sites that take over 3 seconds to load.” Accessed on April 29th, 2022.
-
Google Ads Help. “Optimize your website for mobile.” Accessed on April 29th, 2022.
Author
Jack Flynn is a writer for Zippia. In his professional career he’s written over 100 research papers, articles and blog posts. Some of his most popular published works include his writing about economic terms and research into job classifications. Jack received his BS from Hampshire College.