25+ Essential Job Growth Statistics [2026]: The Latest U.S. Job Growth Trends And Predictions
Research Summary. As we embrace innovative technologies and adapt to evolving work dynamics, job growth trends are continually transformed. Similar to the supply and demand for products, the job market experiences fluctuations. Our latest research indicates:
-
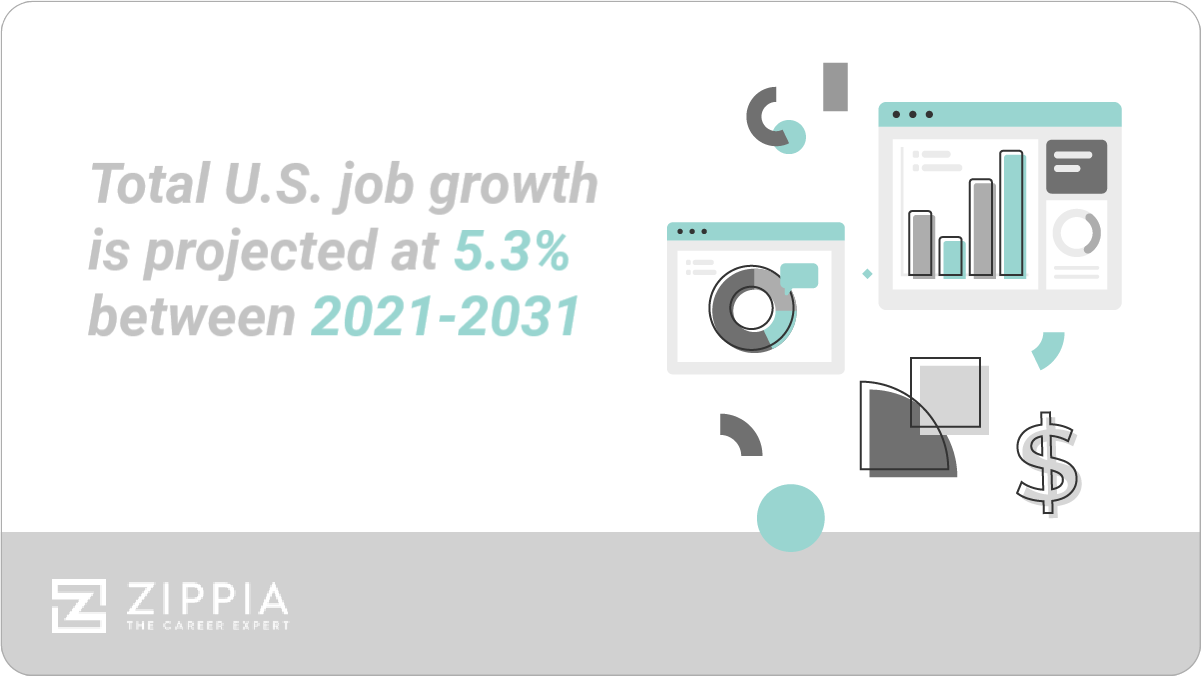
Total U.S. job growth is projected at 7.7% between 2021-2031, translating to an addition of 10.9 million jobs.
-
The fastest-growing occupation is Nurse practitioners, with an anticipated job growth of 45.7% in the same period.
-
Nevada continues to lead the nation with the fastest job growth rate at 5.1%.
For a deeper dive into this data, we organized our analysis in the following categories:
State | Historic Numbers | Industry and Sector | Recent Numbers | Pandemic
Job Growth Statistics By Job Growth Projections
While job growth forecasts for the next decade are subject to change, they offer insights into the expansion of specific fields. The landscape of employment is ever-evolving, and here are the essential figures:
-
Total U.S. job growth is projected at 7.7% between 2021-2031.
This represents a significant increase from the 5.3% growth rate between 2020-2030. The anticipated addition of roughly 10.9 million jobs is notably more than the 8.4 million jobs projected for the previous decade.
-
The fastest-growing job is nurse practitioners, with an expected job growth of 45.7% between 2021-2031.
This role is essential for coordinating patient care and providing both primary and specialty healthcare. The demand for nurse practitioners is driven by an aging population requiring enhanced healthcare services.
The runner-up occupations include Wind Turbine Service Technicians, at a growth rate of 44.3%, and Ushers, Lobby Attendants, and Ticket Takers, with a growth rate of 40.5%.
-
Word processors and typists represent the fastest shrinking jobs, with a job growth rate of -38.2%
Regrettably, it’s estimated that two-thirds of current workers in this field may face layoffs over the next decade, primarily due to automation.
The second largest decline is seen in Parking Enforcement Workers, with a -37.1% job growth rate.
-
The total number of jobs in the U.S. is expected to reach 166.5 million by 2031.
This represents an increase of approximately 10.9 million jobs compared to the current total of 155.6 million. As previously noted, this growth is lower than the 20.5 million jobs added between 2010-2020.
-
Low-paying jobs are also seeing significant growth, with roles like fast food and counter workers projected to grow by 15%.
Other fast-growing but low-paying jobs include Bartenders (32.5%), with all three of these positions averaging less than $25,000 annually.
-
The highest-paying job experiencing rapid growth is Nurse practitioners, with a growth rate of 45.7%.
This role offers a substantial median salary of $120,680 per year. Other lucrative fast-growing careers include Physician assistants (27.6%) and Software Developers (22.5%), all boasting median salaries of $110,000 or more.
Fastest-Growing Jobs in America 2021-2031
| Job | % Projected Job Growth Between 2021-2031 | Median Annual Wage In 2021 |
|---|---|---|
| Nurse Practitioner | 45.7 | $120,680 |
| Wind Turbine Service Technician | 44.3 | $56,260 |
| Usher, Lobby Attendant, & Ticket Taker | 40.5 | $24,440 |
| Motion Picture Projectionist | 40.3 | $29,350 |
| Restaurant Cook | 36.6 | $30,010 |
| Data Scientist | 35.8 | $100,910 |
| Athletes and Sports Competitors | 35.7 | $77,300 |
| Information Security Analysts | 34.7 | $102,600 |
| Statisticians | 32.7 | $95,570 |
| Umpires, Referees, and Other Sports Officials | 31.7 | $35,860 |
| Web Developers | 30.3 | $77,030 |
Fastest-Shrinking Jobs in America 2021-2031
| Job | % Projected Job Growth Between 2021-2031 | Median Annual Wage In 2021 |
|---|---|---|
| Word processors and typists | -38.2 | $44,030 |
| Parking enforcement workers | -37.1 | $46,590 |
| Cutters and trimmers, hand | -28.4 | $30,230 |
| Nuclear power reactor operators | -26.8 | $104,260 |
| Print binding and finishing workers | -24.8 | $36,590 |
| Watch and clock repairers | -24.7 | $44,250 |
| Data entry keyers | -24.7 | $35,630 |
| Telephone operators | -24.5 | $37,630 |
| Switchboard operators, including answering service | -24.0 | $30,150 |
| Electronic equipment installers and repairers, motor vehicles | -23.4 | $40,670 |
Job Growth Statistics By State
Job growth varies across the U.S. due to differing state industries and policies. Here’s what our research revealed regarding state-specific job growth:
-
Nevada maintains the fastest job growth rate, reaching 5.1% overall.
This growth is significantly driven by advancements in the clean energy sector, which has seen a remarkable 38.9% increase in related jobs. Comparatively, Louisiana holds the second-highest growth rate in clean energy at only 11.6%.
The states with the second and third highest job growth rates are Hawaii (4.0%) and California (3.5%).
-
West Virginia has the slowest job growth rate at a mere 0.4%.
This stagnation is attributed to a combination of fewer job opportunities, an industry focus on mining and agriculture, and restrictions that hindered job recovery during the pandemic.
-
California has seen the most job growth, with 1.2 million jobs added from 2021 to 2022.
Following closely are Texas, with 702,800 new jobs, and New York, which recorded 497,900 new jobs. The large population in these states significantly influences their job growth numbers.
-
Alaska has experienced the least job growth, with only 5,600 jobs added from 2021 to 2022.
South Dakota and Delaware follow with 7,900 and 8,700 new jobs, respectively. Interestingly, the state with the lowest population, Wyoming, does not hold the record for the lowest job growth.
States With the Highest Projected Job Growth Rate 2021-2031
| State | % of Job Growth (2021-2031) | Projected # of New Jobs |
|---|---|---|
| Nevada | 5.1 | 74,700 |
| Florida | 4.6 | 427,400 |
| Texas | 4.6 | 611,400 |
| Hawaii | 4.0 | 24,400 |
| Washington | 3.5 | 122,500 |
| Tennessee | 3.2 | 103,300 |
| Utah | 3.2 | 103,300 |
| Alaska | 3.1 | 9,700 |
| Tennessee | 3.0 | 24,900 |
| North Carolina | 3.0 | 144,100 |
States With the Lowest Projected Job Growth Rate 2021-2031
| State | % of Job Growth (2021-2031) | Projected # of New Jobs |
|---|---|---|
| West Virginia | 0.4 | 2,500 |
| Maryland | 0.7 | 18,200 |
| Ohio | 1.4 | 77,800 |
| Iowa | 1.5 | 22,800 |
| Mississippi | 1.5 | 17,600 |
| Colorado | 1.6 | 46,700 |
| Connecticut | 1.7 | 28,700 |
| District of Columbia | 1.7 | 13,000 |
| Wisconsin | 1.7 | 50,300 |
| Louisiana | 1.9 | 35,500 |
Job Growth Statistics By Historic Numbers
Job growth does not follow a linear trajectory; it fluctuates based on numerous factors. Our research shows:
-
April 2020 marked the steepest decline in new jobs since 2015, with a staggering 20.49 million jobs lost.
This decline corresponded with the onset of the COVID-19 pandemic, which resulted in unprecedented job losses. March 2020 also saw significant declines, with 1.5 million jobs lost.
-
June 2020 recorded the highest increase in new jobs since 2015, with 4.51 million jobs added.
While this boom was notable, it only represented a fraction of the jobs lost during the pandemic. Following April 2020, the monthly job creation figures have been consistently higher than pre-pandemic levels.
-
Between January 2019 and January 2020, the U.S. added 2.3 million new jobs.
This was a continuation of steady job growth, with the previous year (2018-2019) also seeing an increase of 2.28 million jobs. Growth rates from 2016 to 2020 were relatively stable until the pandemic disrupted trends.
Job Growth Statistics By Industry and Sector
Job growth varies by sector, particularly influenced by the disruptions caused during the pandemic. Here are key insights about sector-specific job growth:
-
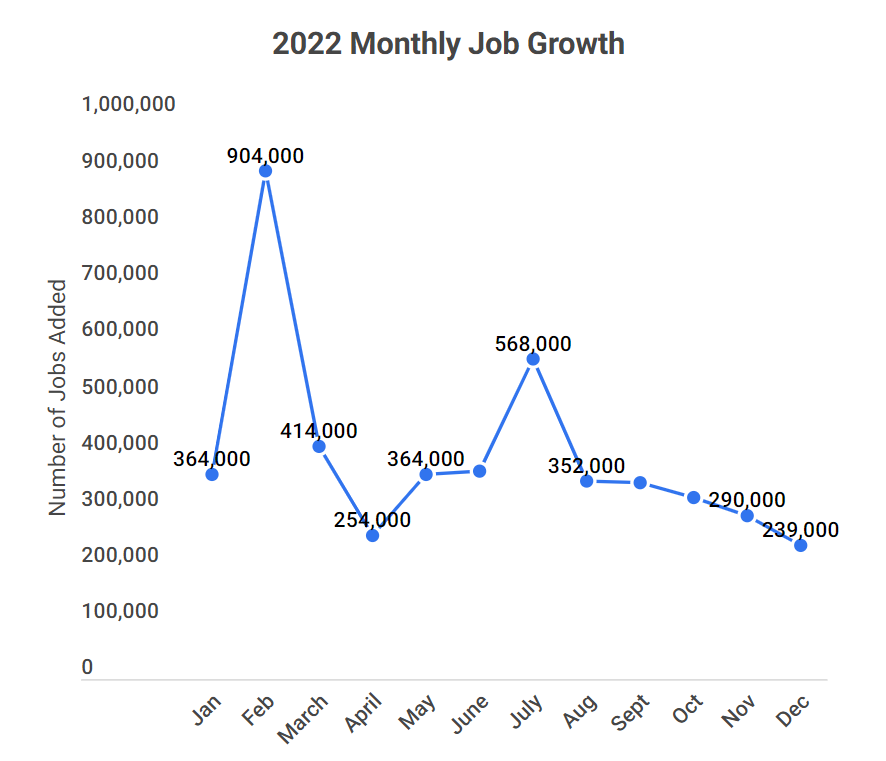
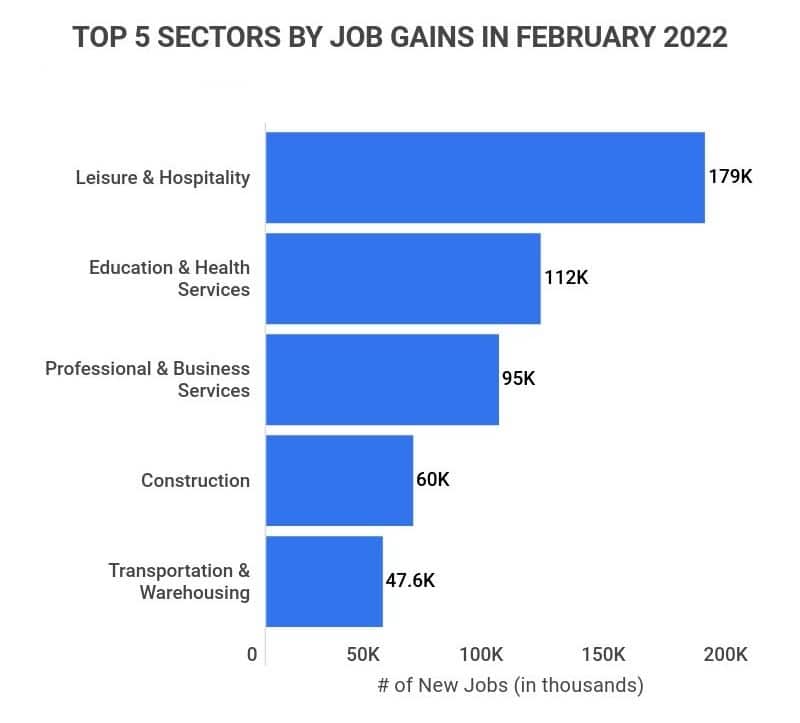
In February 2022, the Leisure & Hospitality sector saw the highest job gains, totaling 179,000.
This growth is a recovery from the substantial job losses experienced during the pandemic, where this sector was the hardest hit. Other sectors such as Education & Health Services (112,000) and Professional & Business Services (95,000) also reported significant increases.
-
In February 2022, the Information and Utility sectors were the only ones to experience no job growth.
These sectors remained relatively stable during the pandemic, showing no significant fluctuations in job availability.
-
The Leisure & Hospitality sector has lost 1.5 million jobs since 2020, the most of any sector.
The Government sector followed with a loss of 681,000 jobs, while the Education & Health Services sector saw a decline of 514,000 positions during the pandemic.
-
The Professional & Business Services sector has seen the most growth post-pandemic, with 596,000 new jobs added.
Transportation & Warehousing gained 584,000 jobs, while the Retail Services sector gained 104,000 positions during the recovery phase.
Job Growth Statistics By Recent Numbers
As of 2026, job growth has rebounded significantly since the pandemic. Our analysis reveals:
-
In September 2022, 263,000 jobs were added.
This figure represents a decrease of 61% compared to the peak job creation month in February 2022. However, it indicates a slow but steady recovery from the pandemic.
-
As of September 2022, the number of jobs available in the U.S. has risen by 9.5% compared to pre-COVID levels.
This marks a significant recovery, with an additional 190,000 jobs available as of September 2022, compared to the pre-pandemic job market.
-
The unemployment rate as of 2022 is only 0.3% higher than pre-COVID rates.
The current unemployment rate is 3.8%, which equates to approximately 6.3 million individuals. This is a marked improvement from the high of 14.7% in April 2020.
-
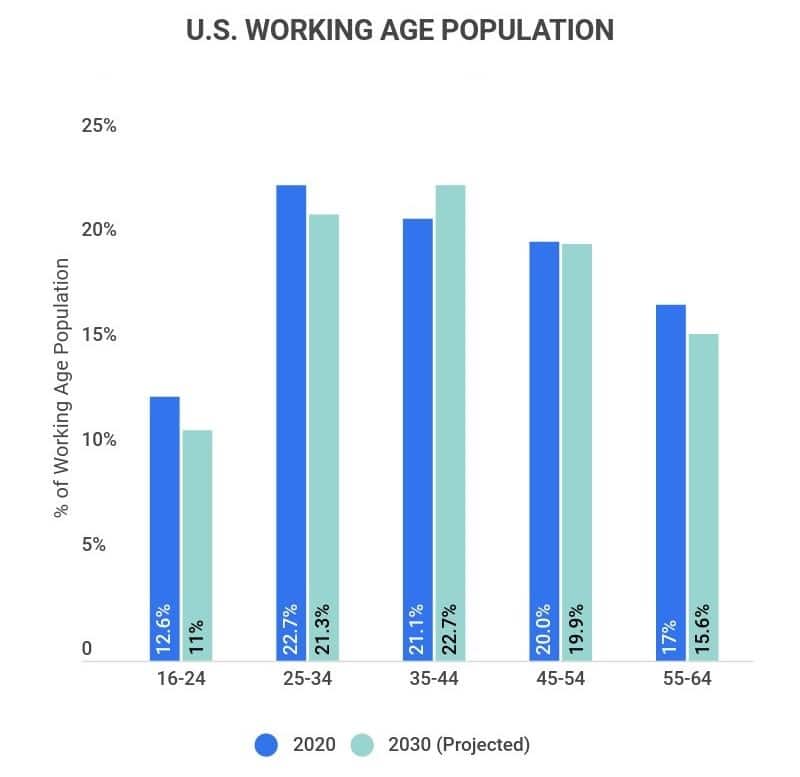
As of 2022, 64.8% of the U.S. population is of working age.
Saudi Arabia has the highest percentage at 72.4%, while Japan has the lowest at 59.3%.
-
Individuals aged 25-34 represent the largest segment of the working-age population in the U.S., accounting for 22.7%.
The second largest group comprises those aged 35-44 at 21.1%. This demographic shift indicates an aging population with fewer children being born.
-
Those aged 16-24 comprise the smallest percentage of working-age adults at 12.6%.
Additionally, individuals aged 55-64 represent 17% of the working-age population, reflecting trends of early retirement and a scarcity of experience among younger job seekers.
Job Growth Statistics By the Pandemic
The COVID-19 pandemic dramatically altered the job landscape, resulting in extensive job losses. Our research indicates:
-
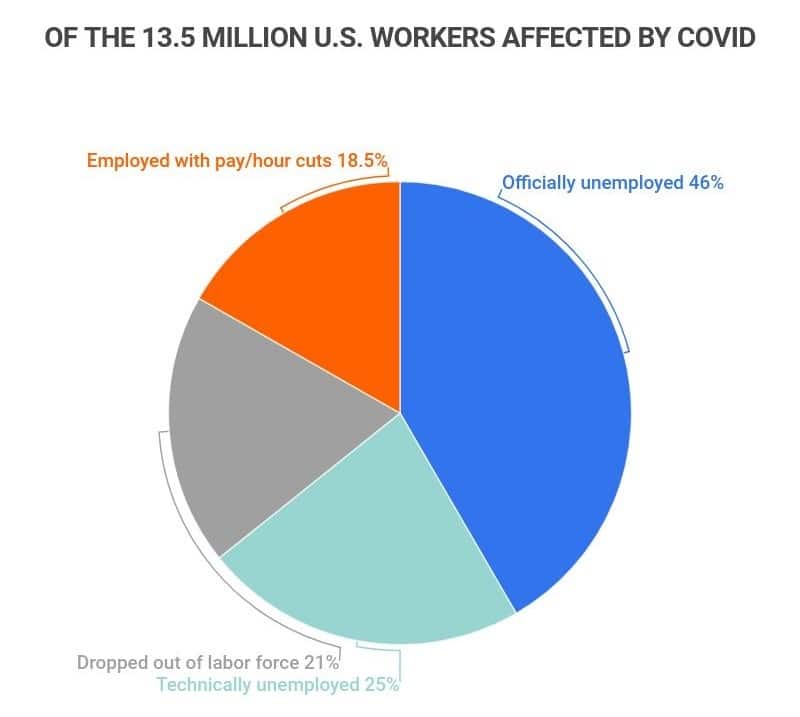
As of February 2022, 13.5 million workers were impacted by the COVID-19 downturn.
This includes 6.3 million officially unemployed, 3.4 million misclassified as employed but not in the workforce, 2.9 million who exited the workforce, and 2.5 million who remain employed but experienced pay cuts and reduced hours.
-
The pandemic has caused a job growth shortfall of approximately 9 million jobs in the U.S.
Had it not been for the pandemic, an estimated 6.9 million new jobs would have been created between January 2019 and February 2022, leaving the job market 2.1 million positions short compared to pre-pandemic levels.
-
From January 2020 to January 2021, the U.S. experienced a net loss of 8.7 million jobs.
Despite ongoing recovery efforts, only about half of the jobs lost have been reinstated, with ongoing fluctuations linked to the pandemic’s impact.
Job Growth Statistics FAQ
-
What is the average growth rate for jobs?
The average growth rate for jobs typically ranges between 5-8%. The projected growth rate of 7.7% between 2021-2031 demonstrates stability, underscoring the significance of a 60-80% job growth rate.
For instance, if a field currently has 50,000 jobs available and a growth rate of 6%, that field would see an increase of 3,000 jobs. Conversely, a 70% growth rate would yield an additional 35,000 jobs.
-
Which job has the highest growth rate?
Nurse practitioners boast the highest job growth rate at 45.7% over the next decade. They are instrumental in identifying and implementing treatments, conducting tests, and analyzing patient data.
The increasing demand is primarily due to the aging population and the push for preventive healthcare standards.
-
Jobs severely affected by automation are currently in decline. Word processors and typists lead the list with a job growth rate of -38.2%.
Unfortunately, two-thirds of individuals in this field may face layoffs over the next decade due to increased automation. Other declining roles include Respiratory Therapy Technicians (-56%) and Parking Enforcement Workers (-35%).
-
Which job will always be in demand?
In general, positions within the healthcare and IT sectors will consistently be in high demand. On the healthcare front, nurse practitioners experienced a job growth of 8.1% before the pandemic, which has since surged to 52.2% between 2020-2030.
Moreover, many tech jobs remain in high demand due to ongoing industry needs, with roles such as software developers forecasted to see a job growth rate of 22.2%.
-
Is 8% job growth considered good?
Yes, an 8% job growth rate is regarded as favorable, as it lies at the upper end of the average spectrum. Though it may not rival a 70% growth rate, an 8% increase can result in hundreds or thousands of new jobs, depending on the existing job market.
For example, a sector with 30,000 jobs available would generate 2,400 new jobs with an 8% growth rate.
Conclusion
Job growth in the U.S. faced significant challenges during the COVID-19 pandemic, with an unprecedented loss of over 20 million jobs in April 2020. However, as of 2026, recovery is well underway, with projections indicating a positive job growth rate of 7.7% from 2021-2031. Notably, roles like Nurse Practitioners and Wind Turbine Service Technicians are experiencing remarkable growth rates exceeding 40%.
While the journey to complete recovery remains ongoing, the overall outlook for job growth is optimistic, showcasing resilience and adaptability in the workforce.
Sources
-
BLS. “Employment Projections: 2010-20 News Release.” Accessed on March 15th, 2022.
-
BLS. “Fastest Growing Occupations.” Accessed on March 15th, 2022.
-
CNBC. “Here are the 15 jobs disappearing the fastest in the US.” Accessed on March 15th, 2022.
-
The Balance. “Jobs Report and the Monthly Employment Growth Statistics.” Accessed on March 15th, 2022.
-
ASU. “Job Growth by State.” Accessed on March 15th, 2022.
-
EPI. “Jobs and unemployment.” Accessed on March 15th, 2022.
-
BLS. “The Employment Situation.” Accessed on March 15th, 2022.
-
OECD. “Working age population.” Accessed on March 15th, 2022.
-
BLS. “ Hours, and Earnings from the Current Employment Statistics survey (National).” Accessed on April 3rd, 2023.
-
BLS. “ Fastest growing occupations.” Accessed on April 3rd, 2023.
-
BLS. “ Employment Projections.” Accessed on April 3rd, 2023.
-
BLS. “ State and Metro Area Employment, Hours, & Earnings.” Accessed on April 3rd, 2023.
Author
Jack Flynn is a writer for Zippia. In his professional career he’s written over 100 research papers, articles and blog posts. Some of his most popular published works include his writing about economic terms and research into job classifications. Jack received his BS from Hampshire College.