- Income Statistics
- Average PTO Days
- What Percentage of Americans Live Paycheck to Paycheck?
- Average American Income
- Millionaire Statistics
- Average Salary out of College
- Average Bonus Statistics
- Minimum Wage Statistics
- Union Benefits Statistics
- Savings Statistics
- Average Annual Raise
- Income Inequality Statistics
- How Many People Make Over 100k?
- Average 401(k) Sstatistics
- Average Net Worth Statistics
- $100k After-Tax Income By State
- Average Global Income
What Is The Average Amount Of PTO Days In America?
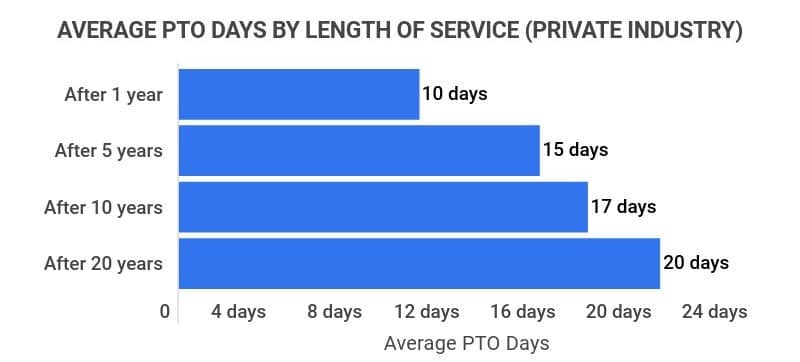
Research Summary. As of 2026, the average amount of paid time off (PTO) days in America is approximately 10 days per year for employees in the private sector. This figure excludes paid holidays such as Thanksgiving and Labor Day. Sick days are generally included within a company’s PTO policy and this average assumes at least one year of service at the organization.
Key Takeaways:
-
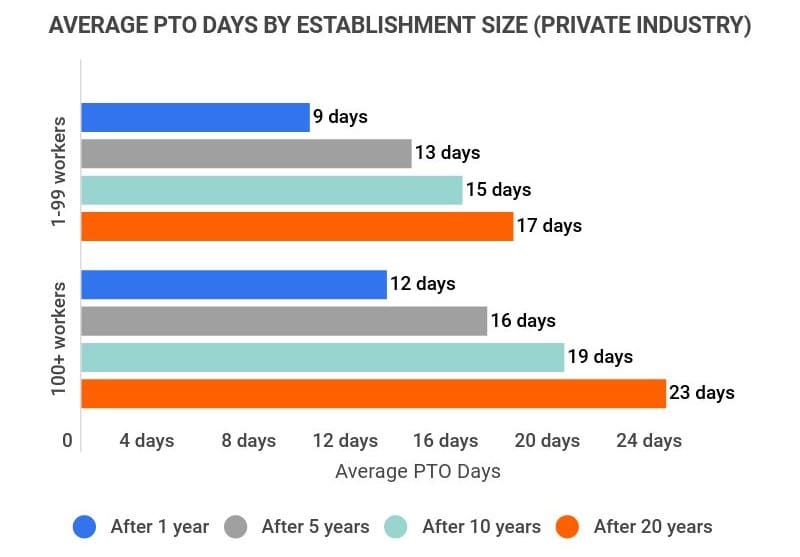
Employees who have been with a company for 5 years typically receive 13 days of PTO at organizations with 1-99 employees, while those at companies with 100+ employees average 16 days.
-
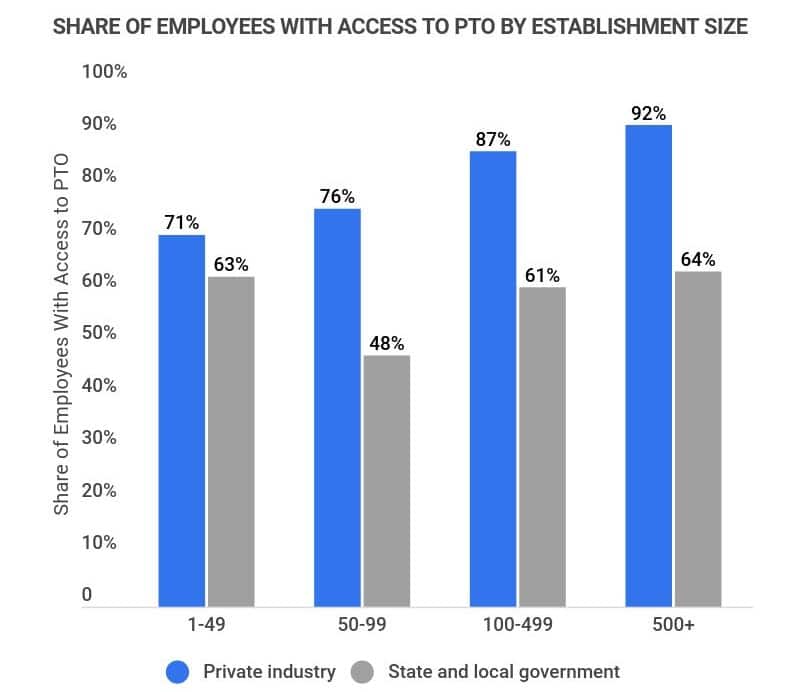
92% of employees in the private industry at firms with 500+ employees have access to PTO, compared to only 64% of state and local government employees at similar-sized organizations.
-
95% of workers in the financial activities and manufacturing sectors have PTO access, whereas only 43% of employees in leisure and hospitality benefit from PTO.
For deeper insights, we analyzed the data in various ways:
Factors | Industry

Factors That Determine Typical PTO Per Year
Generally, working for a larger organization and/or maintaining employment at the same company for several years correlates with increased PTO days.
For instance, private industry employees who have spent over 20 years with a company of 100+ workers typically enjoy an average of 23 PTO days per year, whereas those who have been with a company of 1-99 workers for just one year average 9 PTO days annually.
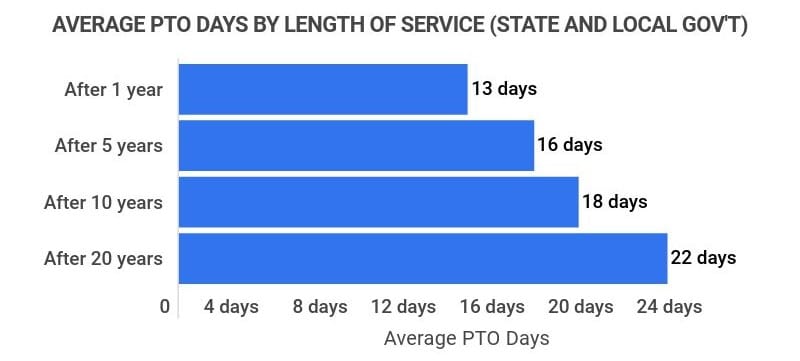
It’s important to note that approximately 28 million Americans do not receive any PTO days at all. Contrary to common belief that small businesses are the primary offenders, state and local governments offer the least PTO plans, regardless of size.
While government employees have less access to PTO days, those who do typically receive 1-2 more PTO days each year compared to their private industry counterparts, depending on tenure.
What Industry Has the Most PTO Days?
The financial activities and manufacturing sectors report the highest availability of PTO days, with 95% of employees in these fields having access to paid time off.
Conversely, the leisure and hospitality sector has the lowest access to PTO, with only 43% of employees receiving such benefits. This showcases a significant disparity compared to the next lowest industry, trade, transportation, and utilities, where 81% of employees have PTO access.
Employees With PTO Access by Industry
| Industry | Share of Employees With Access to PTO |
|---|---|
| Financial activities | 95% |
| Manufacturing | 95% |
| Information | 90% |
| Education and health services | 82% |
| Construction | 82% |
| Professional and business services | 81% |
| Trade, transportation, and utilities | 81% |
| Other services | 73% |
| Leisure and hospitality | 43% |
Average PTO Days in the United States FAQ
-
How much PTO a year is normal?
10 days of PTO per year is standard for private industry employees who have been with their current employer for at least one year. The number of PTO days typically increases with tenure, industry type, and whether the employee works in the private or government sector.
Company size also significantly influences PTO availability; larger organizations (500+ employees) provide PTO to 92% of their workforce, whereas smaller firms (1-49 employees) only extend this benefit to 71% of their staff.
-
Yes, 15 days of PTO is considered favorable for most employees. If a job listing advertises 15 days of PTO for new hires, it is generally regarded as an attractive offer for prospective candidates.
On average, employees need to stay with the same company for around 5 years to reach 15 PTO days annually.
-
Are sick days the same as PTO?
No, sick days and PTO are not the same. However, many employers do not differentiate between sick days, vacation days, or other personal days. In today’s workplace, most companies offer a defined number of PTO days that can be used for any purpose, including sick leave.
-
PTO can be calculated by dividing the total annual PTO by the number of pay periods within a year. For instance, if you are paid biweekly, you will receive 26 paychecks annually. If you earn 10 days of PTO each year, you’ll accumulate 3.08 hours of PTO every two weeks.
Keep in mind that different organizations may have varying policies regarding PTO accumulation, so it’s advisable to consult with your HR department.
Conclusion
The amount of PTO days can differ markedly based on industry and organizational policies, with the average standing at 10 days annually for workers across the United States. Generally, longer tenure with an employer leads to more PTO days, yet millions of American workers still receive no PTO at all.
Understanding your employer’s PTO policies is crucial, so make sure to review them thoroughly and reach out to your HR department if you have any questions.
References
-
U.S. Bureau of Labor Statistics. “Employee Benefits Survey.” Accessed on February 27, 2022.
-
U.S. Bureau of Labor Statistics. “Private Industry Workers Vacation Days.” Accessed on February 27, 2022.
-
Zippia. “PTO Statistics.” Accessed on February 27, 2022.
- Income Statistics
- Average PTO Days
- What Percentage of Americans Live Paycheck to Paycheck?
- Average American Income
- Millionaire Statistics
- Average Salary out of College
- Average Bonus Statistics
- Minimum Wage Statistics
- Union Benefits Statistics
- Savings Statistics
- Average Annual Raise
- Income Inequality Statistics
- How Many People Make Over 100k?
- Average 401(k) Sstatistics
- Average Net Worth Statistics
- $100k After-Tax Income By State
- Average Global Income
Author
Matthew Zane is the lead editor of Zippia's How To Get A Job Guides. He is a teacher, writer, and world-traveler that wants to help people at every stage of the career life cycle. He completed his masters in American Literature from Trinity College Dublin and BA in English from the University of Connecticut.