- Industry Statistics
- Wedding Industry Statistics
- Yoga Industry Statistics
- Music Industry Statistics
- Landscaping Industry Statistics
- Bicycle Industry Statistics
- Coffee Industry Statistics
- Car Rental Industry Statistics
- Home Improvement Industry Statistics
- Insurance Industry Statistics
- Supplements Industry Statistics
- Golf Industry Statistics
- Fitness Industry Statistics
- US Media And Entertainment Industry Statistics
- Firearm Industry Statistics
- Financial Services Industry Statistics
- Health And Wellness Industry Statistics
- Trucking Industry Statistics
- Wine Industry Statistics
- Pet Industry Statistics
- Mobile App Industry Statistics
- Digital Marketing Industry Statistics
- Hotel Industry Statistics
- Retail Statistics
- Robotics Industry Statistics
- Jewelry Industry Statistics
- Appointment Scheduling statistics
- Restaurant Industry Statistics
- Food Delivery Statistics
- Food Truck Industry
- Fashion Industry
- Real Estate Industry
- US Film Industry
- US Beverage Industry
- USu202fFast Food Restaurants
- US Construction Industry
- US Book Industry
- Cosmetics Industry
- US Food Retail Industry
- US Pharmaceutical Industry
- US Healthcare Industry
- Airline Industry
- Automobile Industry
- Transportation Industry Statistics
- Event Industry Statistics
- Project Management Statistics
- Oil And Gas Industry Statistics
- Nursing Home Statistics
- Nursing Shortage Statistics
- Nursing Statistics
Firearm industry research summary. Firearms are loved by some, and hated by others, but you can’t deny that legal firearm ownership sets the U.S. apart from any other country. From supplying the military to Walmart hunting shelves, the prevalence of firearms has created a huge industry. Knowing that, we’ve gathered some of the most compelling U.S. Firearm industry statistics:
-
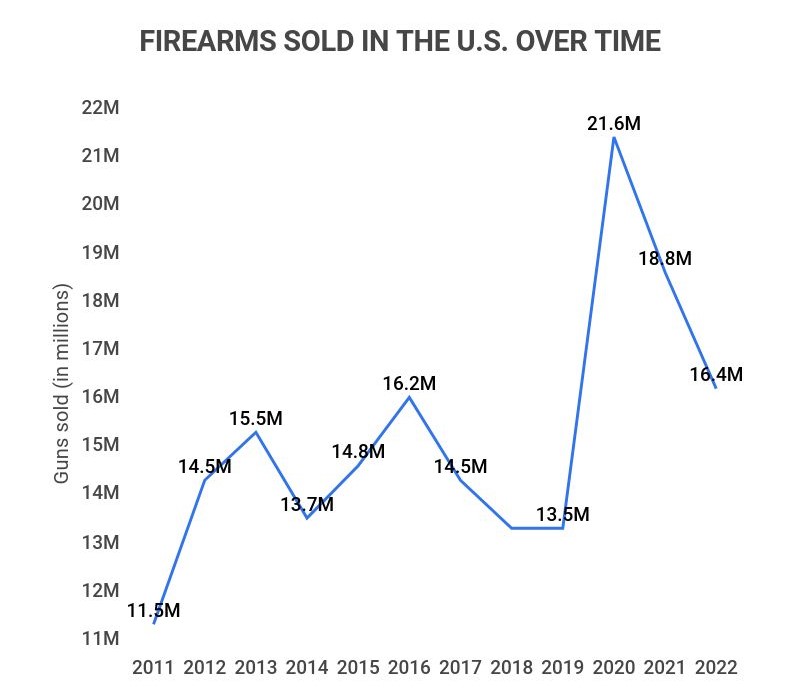
Across the United States, 16.4 million firearms were sold in 2022.
-
The U.S. Firearm industry contributes $51.3 billion to the economy.
-
The firearms industry employs 169,523 people across the U.S.
-
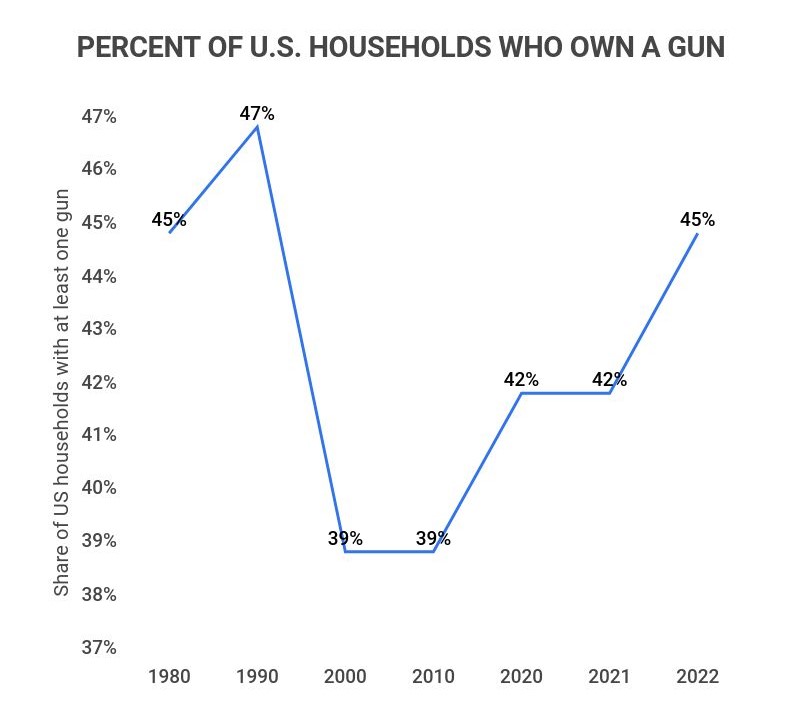
45% of American households own at least one firearm.
-
The U.S. firearm industry is worth approximately $28 billion.
For further analysis, we broke down the data in the following ways:
Types | Trends and Projections | Location | Gun Owners | Gun Safety

Firearm industry by gun manufacturing
Gun manufacturing is always increasing to keep up with immense demand, both militarily and publicly. While not without controversy, this process employs thousands of people around the U.S. Here are the facts:
-
Between 2017 and 2022, between 7 to 9 million guns are manufactured every year.
Gun manufacturing saw an all-time peak in 2016 when just under 11.5 million firearms were produced. Since then, the number of firearms produced each year has fluctuated between 7 and 9 million per year.
However, it’s worth noting that any of these years far outpace gun manufacturing numbers of the early 2000s, which regularly stayed around 3 million per year.
-
Half of U.S. firearm manufacturers produce less than ten guns per year.
Of the 2,111 gun manufacturers recognized by the ATF, half of them produce this small portion of guns. Even combined, that’s less than 10,000 guns, meaning that the other 50% of gun manufacturers are responsible for 99% of the guns manufactured.
-
Just three gun manufacturers are responsible for 58% of the pistols made in America.
These include Smith & Wesson Corp., Sturm, Ruger & Co. Inc., and SIG SAUER Inc. When it comes to guns, the brand is extremely important in perceived quality, which causes the largest companies to dominate the competition.
-
The average salary for a firearms industry employee is between $38,000 and $40,000.
There are different kinds of jobs you can take in the firearms industry, but they all have relatively similar pay (unless you’re a CEO). For instance, the average Gun Salesman makes roughly $38,000 per year, while the average Firearms Technician makes $40,310 per year.

Firearm industry by types of firearms
There are many types of firearms out there, used for a variety of purposes. From pistols purchased for home security to rifles purchased for bird hunting, there’s a gun out there for almost anyone interested in owning one. With that in mind, here are some interesting facts about different types of firearms:
-
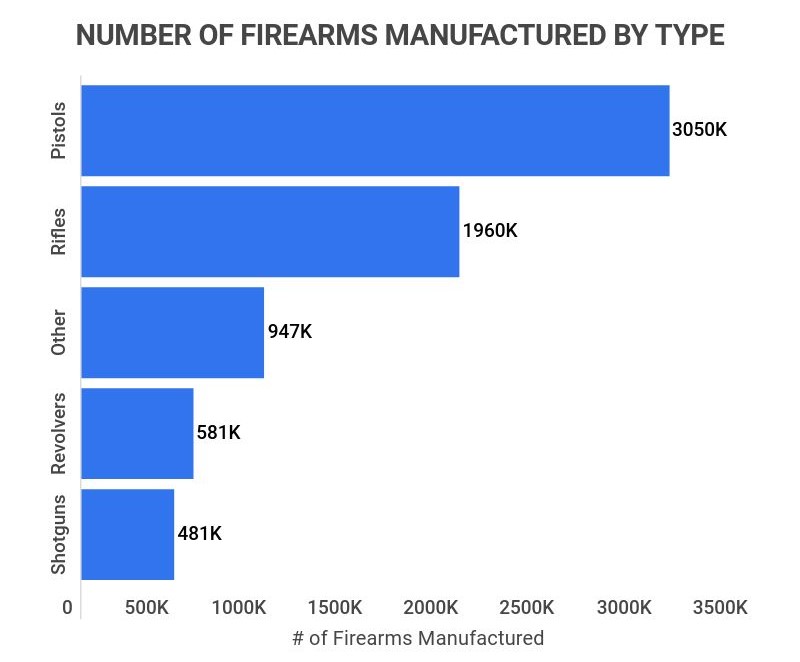
Pistols are the most common gun in America, accounting for 43.4% of guns produced.
In 2019 alone, there were more than 3 million pistols produced in the United States. Pistols are common because they’re often less expensive, easier for beginners to use, and require less licensing.
-
Rifles are the second most common gun type in the U.S., accounting for 28% of guns produced.
In 2019, there were just under 1.96 million rifles produced in the U.S. Rifles are another common type of gun because they’re excellent for recreational sports like hunting, even if larger and more expensive than pistols.
-
Shotguns are the least common of the major gun types produced in the U.S., making up only 7% of guns produced.
There were around 480,000 shotguns sold in 2019; below even the 580,000 revolvers sold. Both of these guns tend to be more expensive and have more kickback, making them less appealing choices for new gun buyers.
-
The U.S. has over over 20 million AR-15-style rifles legally in circulation.
An AR-15, otherwise known as an Armalite Rifle, is an extremely controversial gun in the U.S., owing to the gun’s usage in 12 significant American mass shootings. Due to that status, information about the gun is widely misunderstood, as it’s not an automatic assault rifle.
However, the AR-15 is still a semi-automatic rifle and has many restrictions in states like California or Massachusetts.
-
Smith & Wesson is the largest pistol producer in the U.S., producing 1.2 million pistols and revolvers each year.
Smith & Wesson is a truly massive corporation, and 60% of its sales are made up of pistols and revolvers. The company is also especially popular with the public, as 91.2% of its firearms are sold to domestic consumers.
-
Remington Outdoor is the largest rifle producer in the U.S., producing over 700,000 each year.
Remington Outdoor is known for its rifles, and the company produces nearly three times the number of rifles as Smith & Wesson. Production of these rifles has also increased steadily over time, far surpassing the 300,000 made in 2005.
Firearm industry trends and projections
Firearm industry trends and projections are interesting, given the controversy surrounding the industry. Despite the controversy, it seems the firearm industry has only gotten bigger over time. After all, far more guns are manufactured per year now than there were in the early 2000s. Well, according to our research:
-
Between 2019-2020, gun purchases increased by 60%.
In 2019, there were 13.5 million guns purchased, which grew to 21.6 million in 2020. That number has fallen again slightly to 16.4 million in 2022.
-
Between 2010 and 2020, the number of guns sold in the U.S. more than doubled.
In 2010 there were approximately 10 million guns sold in the U.S., but that number jumped to over 21 million in 2020.
-
As of 2022, the U.S. Guns & Ammunition Manufacturing industry has a market size of $19.5 million.
That’s a 31.75% increase from five years ago (2018) when the industry was worth $14.8 million. However, it is worth mentioning that since a massive revenue spike in 2020, the industry’s revenue has stayed rather steady at around $19 million each year.
-
The global Guns and Accessories industry is expected to experience a CAGR of 6.15% between 2020 and 2027.
Worth $6.14 billion in 2019, the global Guns and Accessories industry is projected to reach $9.33 billion by 2027. The North American market also makes up a large percentage of this market, 52.8% of the total market in 2019.
Firearm industry by location
Firearm ownership in the US also varies by location. While gun ownership is universal across the United States, some states produce more guns than others, and some states have more people interested in gun ownership. Here are some insights our research uncovered about the firearm industry in different states:
-
Texas has the most jobs available in the firearms industry, with over 31,600 jobs currently open.
Though that may not come as a surprise, the fact that California is #2 with 29,000 jobs available. Other than that, though, the rest of the top five states include Florida (22,300), Pennsylvania (18,800), and Ohio (15,200).
-
Illinois has the most background checks in 2021, at over 1 million.
That’s over double that of the next highest state, Kentucky, which had just over 400,000 background checks. All other states had below 300,000, with Indiana, Texas, and Florida (some of the most popular states for gun owners) being in the top five.
-
New Jersey had the highest percentage increase in background checks, at a year-over-year rate of 239.6% in 2021.
Many states have seen staggering increases in background checks, but none more than New Jersey. However, other states with high increases in the number of background checks were Indiana (227.2%), Michigan (155.2%), Maryland (122.1%), and Vermont (97%).
-
Texas has the most registered guns, with 588,696 registered statewide.
However, gun ownership in the state is actually lower than some others, with 45% of the population owning guns. For context, neighboring Oklahoma only has 71,269 guns, but 54.7% of the population owns guns.
-
66.3% of Montana’s population owns a gun.
That’s higher than any other state. In fact, most of the states where a majority of the population own guns tend to be sparsely populated. Examples include Wyoming (66.2%), Alaska (64.5%), and West Virginia (58.5%).
State % Residents who Own Guns Total Registered Guns Montana 66.3% 22.1K Wyoming 66.2% 132.8K Alaska 64.5% 15.8K Idaho 60.1% 49.6K West Virginia 58.5% 35.3K Arkansas 57.2% 79.8K Mississippi 55.8% 35.5K Alabama 55.5% 161.6K South Dakota 55.3% 21.1K North Dakota 55.1% 13.3K -
Only 14.7% of Massachusett’s population owns a gun.
A tie with New Jersey for the lowest rate of gun ownership in the U.S. Other states with low gun ownership rates include Rhode Island (14.8%), Hawaii (14.9%), and New York (19.9%).
State % Residents who Own Guns Total Registered Guns Massachusetts 14.7% 37.2K New Jersey 14.7% 57.5K Rhode Island 14.8% 4.2K Hawaii 14.9% 7.8K New York 19.9% 76.2K Connecticut 23.6% 82.4K Illinois 27.8% 146.5K California 28.3% 344.6K Maryland 30.2% 103.1K Delaware 34.4% 4.8K -
Rhode Island has the least guns per capita, at only three per 1,000 people.
Rhode Island and some other states in New England have exceptionally low guns per capita. While on the contrary, the state with the highest number of guns per capita is Wyoming, with 229 per 1,000 people.
Firearm industry statistics by gun owners
Gun owners are the backbone of the firearm industry’s popularity. Even with potential contributions from the U.S. military, the Firearm industry wouldn’t exist as it does without the millions of consumers who purchase firearms. With that in mind, here are some interesting facts about gun ownership in the United States:
-
As of 2021, guns per capita in the U.S. reached a staggering 120.5 guns for every 100 residents.
To put that in perspective, there are roughly 393 million civilian-owned firearms across the country, which is enough for every man, woman, and child to own at least one. Plus, we’d still have 67 million guns remaining.
-
57.8% of U.S. gun owners are male.
While 42.2% are women, in general, most women choose to only own a handgun or prefer that type of gun over others. On the other hand, far more men own rifles and shotguns than women.
-
White people are the most likely to own a gun in the U.S., with 47% of White people and households owning at least one.
Broken down by race, gun ownership has the following trends: 37% of Black, 26% of Hispanic, and 20% of Asian people and households own firearms in the U.S.
-
45% of people and households who are 65+ years old own at least one gun.
That’s slightly higher than any other age demographic, but they’re all fairly close. For instance, 43% of people and households who are between 18-29 years old and 50-64 own at least one gun.
-
The U.S. alone accounts for roughly 46% worldwide total of civilian-held firearms.
There are over 190 recognized countries, and still, the U.S. population accounts for nearly half of gun ownership around the world. The only country that even comes close is Yemen (currently in a brutal civil war) and the Falkland Islands, which still have around half the guns per capita as the U.S., respectively.
Firearm industry statistics by gun safety
Gun safety is always a concern when discussing the U.S. firearm industry. After all, there’s a reason why guns are so controversial in 2022. To dive deeper into the safety concerns associated with firearms, here are some essential gun safety statistics:
-
There was a 14% increase in gun deaths from 2019 to 2020.
In 2020, 45,222 people died of gunshot wounds, while 39,707 died in 2019. In part, this increase can be attributed to the massive increase in gun purchases and manufacturing in 2020.
-
Licensed dealers have approximately 18,700 firearms stolen from them each year.
While these numbers can be hard to estimate, it’s clear that the number of guns stolen each year is well in the thousands. This poses a huge safety threat to people around the U.S., as those who steal guns never undergo background checks and often have malicious intentions.
-
96% of U.S. civilian deaths caused by police are with a firearm.
However, only 15% of those shot and killed have firearms themselves. The demographics of these deaths are also incredibly skewed, with 95% of victims being male, and Black individuals account for 27%, despite being only 13% of the total population.
Firearm industry FAQ
-
How big is the US gun industry?
The U.S. firearm industry is big in the US and plays a huge role in not only the economy, but also American culture. Not only does the industry contribute more than $70 billion to the US economy, but also contributes a lot of money to politicians. During the 2022 midterm election cycle, gun manufacturers spent $9.55 million. In 2016, election spending reached $54.40 million.
All of the money gun manufacturers pour into elections help maintain stand your ground laws and other friendly policies in US states, which further increases the size and reach of the industry.
-
How much is the firearm industry worth?
The U.S. firearm industry is worth approximately $28 billion. With the most firearms in the world, the U.S. firearm industry contributes a significant amount to the U.S. economy, up to $51.3 billion each year. Further, the economic impact of the firearms industry has increased by 232% since 2008.
-
Yes, the gun industry is growing. In 2020 alone, the industry experienced exceptionally high growth. Between 2019-2020, gun purchases increased by 60% (13.5 million guns purchased to 21.6 million). In a more protracted view, the number of guns sold in the U.S. more than doubled between 2010-2020.
Going forward, the industry is still expected to experience healthy growth after its 2020 high. Overall, the Guns and Accessories industry is expected to experience a CAGR of 6.15% between 2020 and 2027.
-
How many guns were bought in the U.S. in 2021?
16.4 million guns were bought in the U.S. in 2022. While that was a 12.76% decrease from 2021 when there were 18.8 million guns purchased, it’s still an 64% increase from 2010, when around 10 million guns were bought.
-
Are gun manufacturers profitable?
Yes, gun manufacturers are profitable. Gun manufacturers made $19.9 billion in 2020, with most of that money coming from defense contracts. While the industry does make a considerable amount from consumers, its profits are also heavily propped up by the U.S. government.
In fact, gun manufacturers make far more than the shop owners who sell the guns to consumers. The markup on guns can be as low as 10%, leaving owners with very little of the profits.
-
Who is the largest firearm manufacturer?
Sturm, Ruger & Co. is the largest firearm manufacturer in the U.S. The company produces an average of 1.7 million firearms per year, topping out even Smith & Wesson, which produces around 1.5 million.
Others among the top five largest firearm manufacturing companies include Remington Arms (1.1 million), Sig Sauer (500,000), and Vista Outdoor (400,000).
-
How many gun owners live in America?
There are more than 81 million gun owners that live in America. However, that number still doesn’t do justice to the sheer number of guns in the country. As of 2021, guns per capita in the U.S. reached a staggering 120.5 guns for every 100 residents. That means there are 67 million more guns in the U.S. than there are people.
-
What percentage of U.S. households have a gun?
Roughly 45% of U.S. households have a gun. With that number divided between around 35% of those guns owned personally and 10% shared among the household.
Of course, it’s worth noting that not every demographic is created equal. For instance, 47% of White people and households own at least one gun, while only 20% of Asian people and households own one. Those 65+ are also slightly more likely than average to own firearms, with 45% of people and households in that age demographic owning at least one.
Conclusion
With the largest population of civilians owning guns in the world, it’s unsurprising that the U.S. firearm industry is so massive. In fact, there are 7 to 9 million guns manufactured in the country per year, allowing the industry to reach a market size of approximately $28 billion.
Overall, despite concerns regarding the safety of firearms, there are still 120.5 guns for every 100 residents in the U.S. And, with those numbers and new highs recorded in 2020, the industry is undoubtedly here to stay. Through all the controversy, we can expect further growth going forward.
Sources:
-
Black Rifle. “Gun Sales 2021: 5.4 Million Americans Bought a Firearm for the First Time.” Accessed on March 31st, 2022.
-
GOBankingRates. “Gun Industry Contributes $51.3B to US Economy, Research Shows.” Accessed on March 31st, 2022.
-
NSSF. “Firearm and Ammunition Industry Economic Impact Report 2022.” Accessed on March 31st, 2022.
-
Statista. “Percentage of households in the United States owning one or more firearms from 1972 to 2021.” Accessed on March 31st, 2022.
-
Statista. “Number of firearms manufactured in the U.S. from 1986 to 2019.” Accessed on March 31st, 2022.
-
CAP. “The Gun Industry in America.” Accessed on March 31st, 2022.
-
ZipRecruiter. “Firearms Technician Salary.” Accessed on March 31st, 2022.
-
Statista. “Number of total firearms manufactured in the United States in 2019, by firearm category.” Accessed on March 31st, 2022.
-
ABC. “Inside the rise of AR-15-style rifles in America.” Accessed on March 31st, 2022.
-
MoneyTalksNews. “The Biggest Gun Companies in the U.S. Market.” Accessed on March 31st, 2022.
-
The Guardian. “Gun purchases accelerated in the US from 2020 to 2021, study reveals.” Accessed on March 31st, 2022.
-
SafeHome. “Guns in the U.S. – 2021 Second-Highest Year for Gun Sales Since 2000.” Accessed on March 31st, 2022.
-
NSSF. “Background Checks Top 687,000 During Black Friday ‘Week’.” Accessed on March 31st, 2022.
-
IBISWorld. “Guns & Ammunition Manufacturing in the US – Market Size 2003–2028.” Accessed on March 31st, 2022.
-
Fortune Business Insights. “Guns and Accessories Market Size, Share & Impact Analysis.” Accessed on March 31st, 2022.
-
U.S.News. “New Jersey, New Hampshire See Largest Increases in Firearm Background Checks.” Accessed on April 1st, 2022.
-
World Population Review. “Gun Ownership by State 2022.” Accessed on April 1st, 2022.
-
The Washington Post. “There are more guns than people in the United States, according to a new study of global firearm ownership.” Accessed on April 1st, 2022.
-
Gun Ownership Facts. “How Many Guns are in the US? (Gun Ownership Statistics).” Accessed on April 1st, 2022.
-
Pew Research Center. “The demographics of gun ownership.” Accessed on April 1st, 2022.
-
The Trace. “It’s Official: Gun Deaths Hit an All-Time High in 2020.” Accessed on April 1st, 2022.
-
EveryTown. “Stolen Guns Pose a Tremendous Risk to Public Safety.” Accessed on April 1st, 2022.
-
EveryTown. “Gun Violence by Police.” Accessed on April 1st, 2022.
- Industry Statistics
- Wedding Industry Statistics
- Yoga Industry Statistics
- Music Industry Statistics
- Landscaping Industry Statistics
- Bicycle Industry Statistics
- Coffee Industry Statistics
- Car Rental Industry Statistics
- Home Improvement Industry Statistics
- Insurance Industry Statistics
- Supplements Industry Statistics
- Golf Industry Statistics
- Fitness Industry Statistics
- US Media And Entertainment Industry Statistics
- Firearm Industry Statistics
- Financial Services Industry Statistics
- Health And Wellness Industry Statistics
- Trucking Industry Statistics
- Wine Industry Statistics
- Pet Industry Statistics
- Mobile App Industry Statistics
- Digital Marketing Industry Statistics
- Hotel Industry Statistics
- Retail Statistics
- Robotics Industry Statistics
- Jewelry Industry Statistics
- Appointment Scheduling statistics
- Restaurant Industry Statistics
- Food Delivery Statistics
- Food Truck Industry
- Fashion Industry
- Real Estate Industry
- US Film Industry
- US Beverage Industry
- USu202fFast Food Restaurants
- US Construction Industry
- US Book Industry
- Cosmetics Industry
- US Food Retail Industry
- US Pharmaceutical Industry
- US Healthcare Industry
- Airline Industry
- Automobile Industry
- Transportation Industry Statistics
- Event Industry Statistics
- Project Management Statistics
- Oil And Gas Industry Statistics
- Nursing Home Statistics
- Nursing Shortage Statistics
- Nursing Statistics
Author
Jack Flynn is a writer for Zippia. In his professional career he’s written over 100 research papers, articles and blog posts. Some of his most popular published works include his writing about economic terms and research into job classifications. Jack received his BS from Hampshire College.