- Tech Industry Statistics
- MFA Statistics
- Streaming Services Statistics
- Mobile Vs. Desktop Usage Statistics
- AI Statistics
- Live Streaming Statistics
- Zoom Meeting Statistics
- Cord Cutting Statistics
- Digital Transformation Statistics
- Virtual Reality Statistics
- How Fast Is Technology Advancing
- Mobile Commerce Statistics
- SaaS Statistics
- Machine Learning Statistics
- Diversity In High Tech
- Cyber Security Statistics
- Ecommerce Statistics
- Tech Industry
- Gaming Industry
- Renewable Energy Job Creation
- Smartphone Industry
- Cybercrime Statistics
- Amazon Statistics
- Personalization Statistics
Research Summary. Over the past decade, mobile technology has evolved dramatically, with smartphones now being used as frequently, if not more so, than desktops for tasks such as emailing, web browsing, and running applications. Here are some key statistics illustrating the differences between mobile and desktop usage:
-
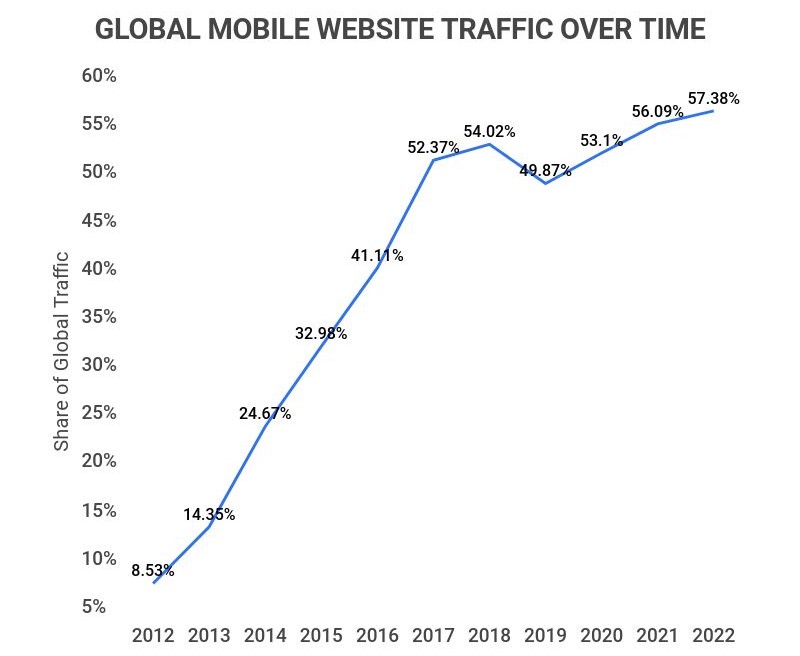
60% of global website traffic originates from mobile devices.
-
51% of internet traffic in the United States is from mobile technology.
-
Approximately half of the time spent online is via mobile devices.
-
From 2017 to 2022, global mobile data traffic increased by about 573%.
-
83% of social media interactions in North America are conducted on mobile devices.
For further insights, we have categorized the data as follows:
Global Stats | Mobile Usage | U.S. Stats | User Behavior
General Mobile Vs. Desktop Statistics
-
63% of search engine queries in the U.S. are conducted on mobile devices.
Due to their convenience, most people now use their phones for searches.
-
15% of internet users in the U.S. rely solely on mobile phones.
These users either cannot or choose not to have traditional broadband access, preferring to use mobile data plans for their internet needs.
-
November 2016 marked the first time mobile traffic surpassed desktop traffic globally.
This pivotal moment in internet history highlighted the shift towards mobile usage for online tasks.
Global Mobile Vs. Desktop Statistics
-
4.97 billion people worldwide access the internet via mobile devices.
This accounts for roughly 90% of all global internet users, indicating that nearly everyone accessing the internet does so through a mobile phone at least once.
-
The global tablet internet market share is approximately 2.4%.
This low percentage is largely due to the prevalence of smartphones, which are often more convenient for users.
-
Mobile technologies dominate social media and entertainment app usage.
As illustrated in the following table, mobile usage is significantly higher for most social media and entertainment applications, which are designed for on-the-go engagement.
Social Media Mobile Usage
App Mobile Usage Share (%) Twitter 80 Facebook 81 LinkedIn 57 YouTube 63 Reddit 72
Time Spent On Mobile And Desktop By Country
| Country | Total Time Spent on Devices (in hours) | Time Spent on Internet via Mobile | Time Spent on Internet via Desktop |
|---|---|---|---|
| South Africa | 10:46 | 5:09 | 5:37 |
| Philippines | 10:27 | 5:47 | 4:40 |
| Brazil | 10:19 | 5:25 | 4:54 |
| Colombia | 10:03 | 5:09 | 4:54 |
| Argentina | 9:38 | 5:04 | 4:34 |
| Malaysia | 9:10 | 4:49 | 4:21 |
| Thailand | 9:06 | 5:28 | 3:38 |
| Mexico | 8:55 | 4:37 | 4:18 |
| Indonesia | 8:37 | 4:56 | 3:41 |
| UAE | 8:36 | 4:35 | 4:01 |
| Taiwan | 8:07 | 4:12 | 3:55 |
| Saudi Arabia | 8:05 | 4:35 | 3:30 |
| Egypt | 8:02 | 4:25 | 3:37 |
| Turkey | 8:00 | 4:16 | 3:44 |
| Portugal | 7:56 | 3:34 | 4:22 |
| Russia | 7:50 | 3:39 | 4:11 |
| Israel | 7:35 | 3:31 | 4:04 |
| Singapore | 7:28 | 3:38 | 3:50 |
| India | 7:18 | 4:05 | 3:13 |
| Romania | 7:09 | 3:41 | 3:28 |
| United States | 7:04 | 3:30 | 3:34 |
| Hong Kong | 6:46 | 3:31 | 3:15 |
| Canada | 6:45 | 2:51 | 3:54 |
| Poland | 6:40 | 2:58 | 3:42 |
| Vietnam | 6:38 | 3:32 | 3:06 |
Mobile Usage Statistics
-
Americans spend an average of 4.1 hours daily on their smartphones.
This represents a significant portion of their waking hours, as 4 hours is about 25% of the time we are awake.
-
iOS holds a 59% market share in U.S. cellular usage, with Android following at 40%.
The popularity of iPhones among American consumers is a key reason for the dominance of iOS.
-
Mobile apps boast a conversion rate three times that of mobile websites and 1.5 times that of desktop sites.
Thanks to targeted advertisements and tailored experiences, mobile apps are highly effective in converting users into buyers.
U.S. Mobile Vs. Desktop Statistics
-
83% of U.S. residents use smartphones to access the internet.
This indicates that nearly all Americans have the capability to go online using their phones, showcasing the deep integration of mobile technology in American society.
-
Americans average 4.1 hours per day on phones, compared to 3.5 hours on desktops.
This is a difference of about 36 minutes, or 2.5%, reflecting the convenience of mobile devices that accompany users throughout their day.
-
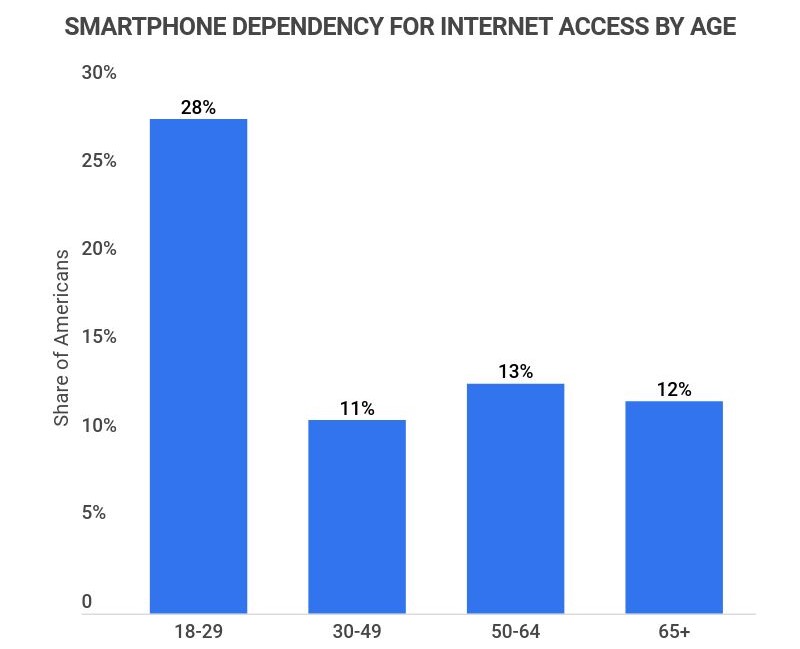
Younger generations are significantly more likely to use mobile devices over desktops.
This trend is expected, as older generations tend to be more comfortable with traditional desktops, while younger users increasingly rely on their portable devices.
Mobile, Desktop, and Tablet Usage By Age
Age Range Mobile Usage (%) Desktop Usage (%) Tablet Usage (%) 18-24 79 19 2 25-34 68 29 3 35-44 60 37 3 45-54 54 41 5 55-64 41 53 6 65-74 30 62 7 75+ 15 76 8
Mobile Vs. Desktop Statistics by User Behavior
-
Mobile users in the U.S. are 11% more likely to bounce from websites or applications than desktop users.
This indicates that mobile users may be less engaged with the content they access compared to their desktop counterparts.
-
Mobile users spend 49% less time on sites than desktop users.
On average, mobile users spend about 158 seconds per page, while desktop users spend around 323 seconds. This highlights the need for sites to capture mobile users’ attention quickly to retain viewership.
Mobile Vs. Desktop Usage Statistics FAQ
-
What percentage of global internet traffic is mobile?
60% of global internet traffic is mobile. This figure has increased significantly since the advent of mobile internet technology in the early 21st century, and it continues to rise, with mobile traffic growing by 5% over the last five years.
This underscores the importance of mobile users as a primary access point to the internet, especially in regions where traditional desktop infrastructure is limited.
-
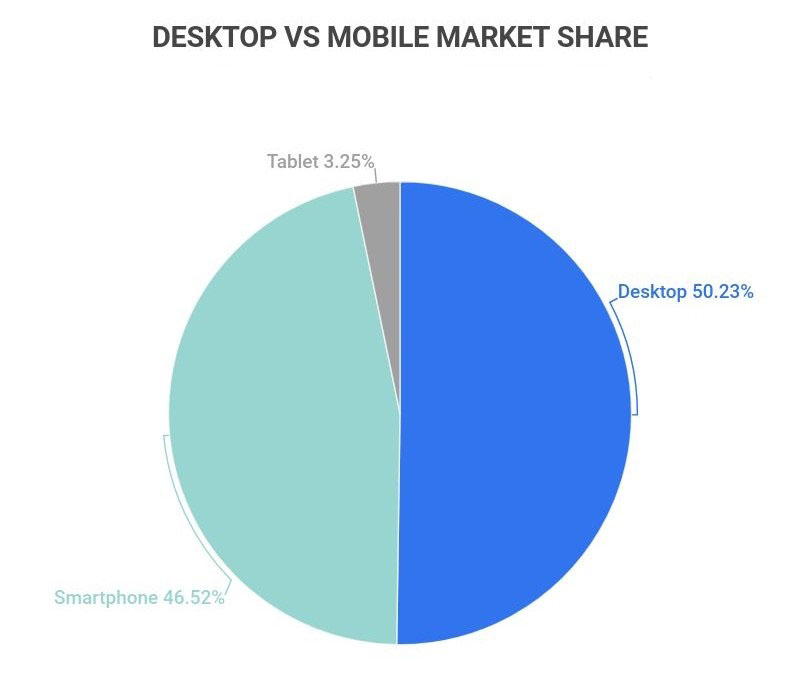
Are there more mobile users than desktop users?
Globally, mobile users outnumber desktop users, while in the U.S., the split is more balanced. Mobile usage accounts for about 56% of global internet access, compared to 41% for desktops. In the U.S., mobile comprises approximately 51% of usage, while desktop holds 49%. This disparity reflects the varying infrastructure and economic conditions across different regions, with mobile technology thriving in areas where desktop access is less feasible.
-
What percentage of the U.S. internet traffic is mobile?
51% of internet traffic in the U.S. is mobile. This statistic reveals the continued relevance of desktop systems, particularly in professional and academic contexts where they remain essential.
-
Is YouTube more popular on mobile or desktop?
YouTube viewing is predominantly mobile, with mobile devices accounting for 63% of total viewership. This popularity can be attributed to the YouTube app, which offers users convenient access to videos, especially in situations where desktops are unavailable.
-
What country uses the most mobile data per capita?
Finland leads in mobile data usage per capita, averaging about 34 GB/month for each individual. This figure is nearly 10 GB higher than the second-ranked country, Taiwan, due to factors like robust infrastructure and affordable data plans that encourage high mobile usage.
Conclusion
In conclusion, mobile internet usage is an undeniable force in today’s digital landscape. In the U.S., the usage between mobile and desktop is nearly equal, yet a closer look reveals that younger generations are increasingly favoring mobile devices. This trend is poised to persist, with these younger users playing an increasingly significant role in the U.S. economy as they age.
Globally, users are turning to mobile devices as their primary means of internet access. For businesses striving to expand, investing in a strong mobile presence is essential. Looking ahead, it is anticipated that mobile technology will take precedence over desktop technology, further solidifying its status as the dominant form of internet access for consumers.
References
-
Perficient. “Mobile vs. Desktop Usage in 2020.” Accessed April 14, 2022.
-
Statista. “Distribution of daily time spent online via mobile and PC by internet users worldwide from 2013 to 2019.” Accessed April 14, 2022.
-
Oberlo. “What Percentage of Internet Traffic is Mobile?” Accessed April 14, 2022.
-
Statista. “Mobile social media worldwide – Statistics & Facts.” Accessed April 14, 2022.
-
GlobalStats. “Desktop vs Mobile vs Tablet Market Share United States Of America Mar 2021 – Mar 2022.” Accessed April 14, 2022.
-
Google Case Studies. “Twitter Lite PWA Significantly Increases Engagement and Reduces Data Usage.” Accessed April 14, 2022.
-
Findstack. “The Ultimate List of LinkedIn Statistics for 2022.” Accessed April 14, 2022.
-
eMarketer. “Compared to Facebook and Twitter, Reddit Has Room to Grow on Mobile.” Accessed April 14, 2022.
-
Pew Research Center. “Mobile Technology and Home Broadband 2021.” Accessed April 14, 2022.
-
CNET. “Americans spent a third of waking hours on mobile devices in 2021, report finds.” Accessed April 14, 2022.
-
Eventya. “Why Mobile Apps Have Higher Conversion Rates Than Websites.” Accessed April 14, 2022.
-
Comparitech. “Screen Time Statistics: Average Screen Time in US vs. the Rest of the World.” Accessed April 14, 2022.
-
EMI Research Solutions. “The Link Between Device Usage and Age: Impacts on Results.” Accessed April 14, 2022.
-
Telegeography. “Finns Lead the Way in Mobile Data Usage.” Accessed April 14, 2022.
-
Statista. “Percentage of mobile device website traffic in the United States from 1st quarter 2015 to 2nd quarter 2022” Accessed March 28, 2023.
-
Statista. “Percentage of mobile device website traffic worldwide from 1st quarter 2015 to 4th quarter 2022” Accessed March 28, 2023.
-
Statista. “Internet usage in the United States – Statistics & Facts” Accessed March 28, 2023.
-
Statista. “Mobile internet usage worldwide – Statistics & Facts” Accessed March 28, 2023.
-
Statista. “Global mobile data traffic from 2017 to 2022” Accessed March 28, 2023.
-
Statista. “Mobile search – Statistics & Facts” Accessed March 28, 2023.
- Tech Industry Statistics
- MFA Statistics
- Streaming Services Statistics
- Mobile Vs. Desktop Usage Statistics
- AI Statistics
- Live Streaming Statistics
- Zoom Meeting Statistics
- Cord Cutting Statistics
- Digital Transformation Statistics
- Virtual Reality Statistics
- How Fast Is Technology Advancing
- Mobile Commerce Statistics
- SaaS Statistics
- Machine Learning Statistics
- Diversity In High Tech
- Cyber Security Statistics
- Ecommerce Statistics
- Tech Industry
- Gaming Industry
- Renewable Energy Job Creation
- Smartphone Industry
- Cybercrime Statistics
- Amazon Statistics
- Personalization Statistics
Author
Conor McMahon is a writer for Zippia, with previous experience in the nonprofit, customer service and technical support industries. He has a degree in Music Industry from Northeastern University and in his free time he plays guitar with his friends. Conor enjoys creative writing between his work doing professional content creation and technical documentation.