- HR Statistics
- Average Labor Cost Percent Of Sales
- Average Time to Reach Profitability At A Startup
- Office Space Per Employee
- Recruitment Statistics
- Employee Engagement Statistics
- Work-Life Balance Statistics
- BYOD Statistics
- Paternity Leave Statistics
- Onboarding Statistics
- Average Paid Maternity Leave In Us
- Average Cost Of A Bad Hire
- Employee Theft Statistics
- Paid Family Leave Statistics
- Cost Of Hiring Statistics
- Employee Turnover Statistics
- Average Cost Of Employer Sponsored Health Insurance Statistics
- Sexual Harassment In The Workplace Statistics
- HR Statistics
- PTO Statistics
- Social Media Recruitment Statistics
- Hiring Statistics
- Out Of Prison Employment Statistics
PTO research summary. While the U.S. federal government does not mandate paid time off (PTO), most companies offer employees between 5 and 15 days of PTO annually, which may include vacation, personal, and sick days.
However, a significant number of Americans still work without any paid time off. What accounts for this disparity, and how much PTO do workers typically receive? After comprehensive research, our data analysis team has provided the following insights:
-
10 days is the average PTO offered in the U.S. private sector, excluding paid holidays and sick leave.
-
55% of Americans do not utilize their full paid time off entitlement.
-
In 2018, American workers left behind an astounding 768 million days of unused PTO.
-
In 2022, employees averaged 9.5 unused PTO days, which equated to 55% of the total PTO granted by employers.
-
63% of employees indicated they would decline a job offer that didn’t include PTO.
-
Approximately 28 million Americans lack access to paid vacation or holidays, making the U.S. the only advanced economy without guaranteed paid time off.
For a deeper dive into the data, we’ve categorized it as follows:
Length | Usage | Reasons | Age | Industry | Location | Illness | Additional
Paid Time Off Statistics by Length
The length of paid time off can vary significantly based on factors like company size and employee tenure, averaging nearly 24 days per year. Most employees, however, do not use approximately 9.5 days of their annual PTO.
-
As many as 31% of employees do not receive any paid time off.
-
Despite the importance of PTO, a majority (74%) of employees would prefer a salary increase over more time off, with over half indicating that their current time off is sufficient.
-
77% of educators expressed a preference for a pay raise rather than additional PTO.
-
On average, employees earned 23.9 days of PTO (including paid holidays and sick leave) in 2018, a modest increase from 23.2 days in 2017.
-
Employees receiving a lump sum of PTO typically get an average of 8.8 days.
-
16% of employees reported having an unlimited vacation policy.
-
Unlimited vacation policies saw a surge of 178% between 2015 and 2019, as per job posting analyses.
PTO Statistics by Usage
While paid time off is available to all employees, the extent to which it is used varies. Here are some notable statistics about PTO utilization:
-
High earners, those making over $150,000 annually, took an average of 22.5 days of PTO, leaving only 3.1 days unused.
-
In 2022, more than half of Americans (55%) did not fully utilize their PTO, a stark contrast to (27.2%) who left PTO unused in 2018.
-
Typically, employees at small businesses earn an additional three to four days of PTO for every five years of service.
-
52% of employees with PTO admitted to working during their time off.
-
American workers failed to use 768 million days of PTO in 2018, marking a 9% increase from 2017.
-
The average number of unused PTO days rose to 9.5 days in 2022, compared to 6 days in 2017.
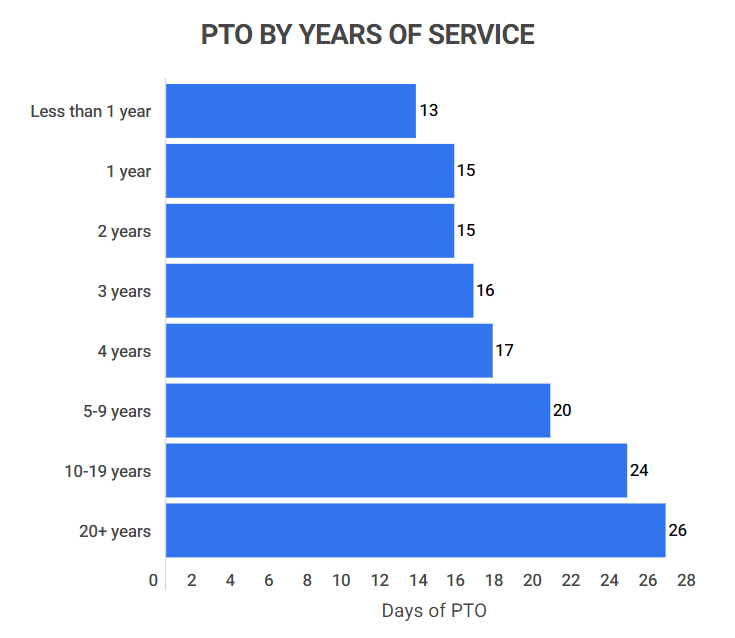
PTO by Years of Service
| Years of Service | Average Number of PTO Days |
|---|---|
| Less Than 1 Year | 13 |
| 1 Year | 15 |
| 2 Years | 15 |
| 3 Years | 16 |
| 4 Years | 17 |
| 5-9 Years | 20 |
| 10-19 Years | 24 |
| 20+ Years | 26 |
Reasons for Paid Time Off
Employees often take paid time off for various reasons, from mental health to catching up on sleep. However, many do not communicate these reasons to their manager.
-
Over half of employees (54%) with PTO have utilized sick days for mental health purposes in the past year, often without disclosing their reasoning to their boss.
-
1 in 5 employees reported misleading their manager about the reason for their time off, with 25% of those citing a need for sleep and 50% for mental health days.
-
71% of employees took a “staycation” in the past year.
-
85% of employees believe that employers should provide sick leave.
-
72% advocate for maternity leave, despite only 11% of employers offering it.
-
In 2018, Americans used an average of 9 days of PTO for travel, which was one day more than in 2017.
-
Approximately three-quarters of American workers consider it crucial for employers to offer paid vacation time (76%), paid sick time (74%), and paid holidays (74%).
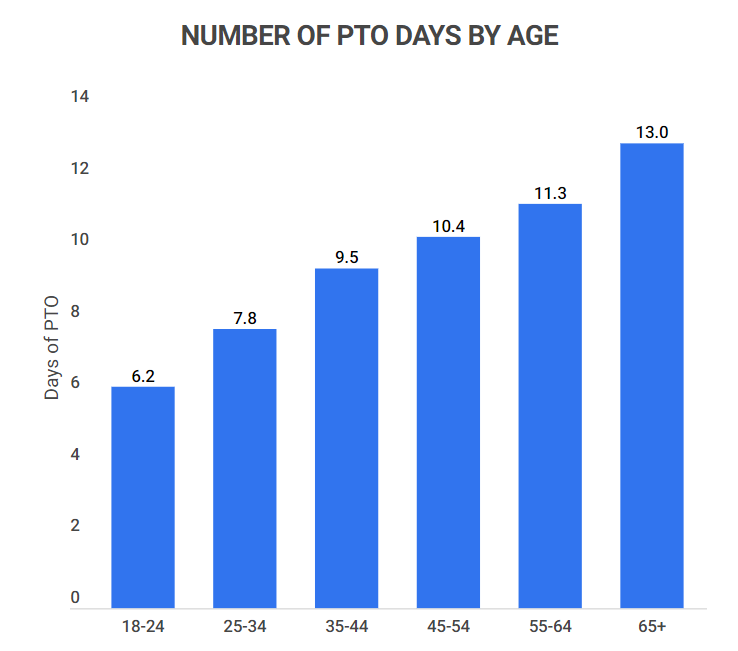
Paid Time Off Statistics by Employee Age
Paid time off usage tends to increase with age, with younger generations receiving about half as much PTO as their older counterparts.
-
About one-third of baby boomers (35%) and Gen X (31%) reported taking 10-19 days off in 2018, compared to only one in five Millennials (21%).
-
Parents of older children tend to take more time off compared to parents of younger children.
Number of PTO Days by Age
| Age | Average Number of PTO Days |
|---|---|
| 18-24 | 6.2 |
| 25-34 | 7.8 |
| 35-44 | 9.5 |
| 45-54 | 10.4 |
| 55-64 | 11.3 |
| 65+ | 13.0 |
PTO Statistics by Industry
Paid time off varies widely by industry, with those in professional and technical fields generally receiving more PTO than those in blue-collar and service roles.

-
76% of private industry workers (representing 84.7% of the workforce) receive paid vacation days.
-
Employees in professional, technical, and related fields with one year of experience receive an average of 10 paid vacation days per year. This increases to 17.8 days after 25 years.
-
Clerical and sales employees with one year of experience average 8.6 paid vacation days per year. This rises to 16.4 days after 25 years.
-
Blue-collar and service employees with one year of experience receive an average of 6.8 paid vacation days per year. This increases to 14.1 days after 25 years.
-
In the hospitality and food service industry, 32% of employees report they do not receive any paid time off, with nearly 60% stating they don’t receive enough time off, and only 15% say they refrain from working when sick.
-
Workers in the information industry (e.g., tech and media) are more likely to use their PTO for travel compared to those in other sectors.
-
Employees in finance and insurance take more vacation days and use a greater share of their PTO for travel purposes.
Paid Time Off by Industry
| Industry | Average Number of PTO Days |
|---|---|
| Non-Profit / Foundation | 17.5 |
| Government / Military | 17.3 |
| Utilities | 15.8 |
| Media / Printing / Publishing / Broadcasting | 14.8 |
| Manufacturing | 14.2 |
| Agriculture / Forestry / Fishing | 14.0 |
| Finance / Banking / Insurance | 14.0 |
| Internet (Including SaaS/Mobile) | 13.7 |
| Telecommunications | 12.3 |
| Engineering / Architecture | 11.4 |
| Communications | 10.9 |
| Legal | 10.9 |
| Wholesale | 10.6 |
| Healthcare / Medical (including Hospice/Homecare/Outpatient) | 10.4 |
| Business / Professional Services | 9.8 |
| Real Estate | 9.7 |
| Transportation / Distribution | 8.7 |
| Entertainment / Recreation | 8.6 |
| Construction / Home Improvement | 8.5 |
| Education | 8.5 |
| Retail | 8.3 |
| Computers (Hardware, Desktop Software) | 7.9 |
| Business Services (Hotels, Lodging Places) | 7.8 |
| Biotechnology | 7.2 |
| Food Service / Hospitality / Travel (including restaurants, hotels, etc.) | 6.9 |
| Consulting | 6.0 |
| Accounting | 5.6 |
| Aerospace / Aviation | 5.3 |
| Automotive (Sales/Repair) | 4.7 |
| Advertising | 3.3 |
| Mining | 2.0 |
| Marketing / Market Research / Public Relations | 0.0 |
Paid Time Off Statistics by Geographic Location
The availability of PTO can vary significantly based on geographic location, influencing the number of paid time off days employees receive.
-
Midwestern workers tend to take the most vacation days and utilize a greater share of their PTO for travel purposes.
-
A study by QuickBooks Time in Canada indicated that Canadian employers typically offer 10 days of PTO per year.
-
This same study found that Australian employers generally provide between 16 and 20 days of PTO annually.
-
While U.S. employees are less likely to receive PTO compared to their Canadian or Australian counterparts, 74% of U.S. workers would prioritize a salary increase over additional PTO.
-
In contrast, only 14% of Australian workers and 8% of Canadian workers report having no PTO.
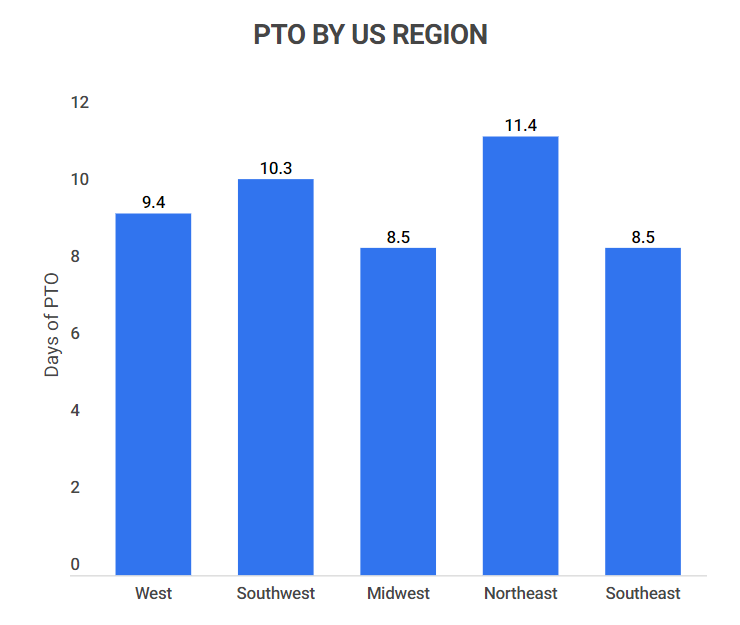
Paid Time Off by U.S. Region
| Region | States | Average PTO Days |
|---|---|---|
| West | California, Nevada, Utah, Idaho, Montana, Wyoming, Colorado | 9.4 |
| Southwest | Arizona, New Mexico, Texas, Oklahoma | 10.3 |
| Midwest | Kansas, Nebraska, South Dakota, North Dakota, Missouri, Iowa, Minnesota, Michigan, Illinois, Ohio, Wisconsin, Indiana | 8.5 |
| Northeast | Maine, New York, Massachusetts, Rhode Island, New Hampshire, Vermont, Connecticut, Delaware, New Jersey, Pennsylvania | 11.4 |
| Southeast | West Virginia, DC, Carolinas, Virginia, Tennessee, Arkansas, Louisiana, Alabama, Florida, Georgia, Kentucky, Maryland | 8.5 |
PTO Statistics Related to Illness
Illness-related PTO is a common concern, with many employees feeling pressured to work while sick, often for extended periods.
-
33% of employees reported that their workplace culture incentivizes coming to work while sick.
-
84% of employees with PTO admitted to working while sick, with 13% noting they do so for more than a week each year.
-
19% of employees acknowledged going to work while sick more than once per month.
-
12% of employees indicated they work while sick around six times a year.
Additional Paid Time Off Statistics
-
There is no federal law mandating vacation pay; the Fair Labor Standards Act (FLSA) does not require payment for non-working time, meaning employees are not legally entitled to paid vacation or holidays.
-
Employees often experience increased productivity, innovation, relaxation, engagement, and work-life balance after taking time off.
-
If a larger portion of Americans utilized their PTO for travel, it could potentially generate $151.5 billion in economic activity for the travel sector, creating two million jobs in the process.
-
The average length of PTO varies significantly based on factors such as tenure, public versus private sectors, geographic location, company policy, collective bargaining agreements, and informal arrangements between employees and management.
-
Typically, larger companies offer more days of paid time off.
-
Employees experiencing high levels of work-related stress are more likely to forfeit PTO, work during their time off, and take additional time off for mental health reasons.
Paid Time Off FAQ
-
What is PTO?
PTO stands for Paid Time Off. This is time that employees can take off from work while still receiving pay. Employers typically allocate PTO as a lump sum that can be used for any reason, such as vacation, personal time, or not covered sick days.
-
How many PTO days per year is normal?
10 days is considered the standard amount of PTO. This figure is based on averages calculated by the Bureau of Labor Statistics, which notes the typical average is 9.7 days, rounded to 10 full days. This amount does not include sick days or paid holidays.
-
What percentage of companies use PTO?
Nearly 100% of companies implement some form of PTO. Currently, 81.5% of private industry employees have access to paid vacation time, with this number increasing to 92% for larger companies (500+ employees) and decreasing to 71% for smaller firms (1-49 employees). Notably, 97% of civilian workers receive paid holidays for major holidays like Thanksgiving and Christmas, indicating that almost all companies provide some level of paid time off each year.
-
What is the average PTO rate?
The average PTO rate is 10 days per year for private-sector employees with at least one year of tenure. This figure does not encompass sick days or paid holidays, which typically account for another 7-8 days of paid time off.
-
What is a good PTO accrual rate?
A good PTO accrual rate is 4 hours per bi-weekly pay period. At this rate, employees accumulate 104 PTO hours (13 eight-hour days) annually. For example, if your PTO accrual rate is 2.8 hours per bi-weekly pay period, multiplying by 3.25 yields approximately 9.1 PTO days (72.8 hours) per year.
-
Is 15 days PTO good?
15 PTO days is considered good for entry-level positions. Given that the average amount of PTO is 10 days, 15 days can be seen as generous for most roles. However, it is essential to recognize that many mid- and upper-level positions are granted additional PTO as well as those who have been with the company longer.
-
How many vacation days are normal?
10 vacation days are typical for most American businesses. This aligns with the standard PTO figure, as vacation days are generally considered part of PTO.
References
USTravel.org. Paid Time Off Trends in the US. Accessed 7/15/21.
Intuit Quickbooks. How Much PTO Should I Give My Employees? Accessed 7/15/21.
U.S. Bureau of Labor and Statistics. Economic News Release – Average Paid Holidays. Accessed 7/16/21.
U.S. Bureau of Labor and Statistics. Employee Benefits Survey. Accessed 7/16/21.
Zenefits.com. How Much is the Average PTO in the U.S.? Accessed 7/16/21.
Society for Human Resource Management. Paid Leave Benchmarking Report. Accessed 7/16/21.
CNBC.com. Here’s how many paid vacation days the typical American worker gets. Accessed 7/16/21.
Patriot Software. Use the Average Vacation Time to Build Your Business’s Policy. Accessed 7/16/21.
Vacation Tracker. What’s the PTO Average in the U.S.? Accessed 7/16/21.
The Balance Careers. Vacation Time and Pay For Employees. Accessed 7/16/21.
- HR Statistics
- Average Labor Cost Percent Of Sales
- Average Time to Reach Profitability At A Startup
- Office Space Per Employee
- Recruitment Statistics
- Employee Engagement Statistics
- Work-Life Balance Statistics
- BYOD Statistics
- Paternity Leave Statistics
- Onboarding Statistics
- Average Paid Maternity Leave In Us
- Average Cost Of A Bad Hire
- Employee Theft Statistics
- Paid Family Leave Statistics
- Cost Of Hiring Statistics
- Employee Turnover Statistics
- Average Cost Of Employer Sponsored Health Insurance Statistics
- Sexual Harassment In The Workplace Statistics
- HR Statistics
- PTO Statistics
- Social Media Recruitment Statistics
- Hiring Statistics
- Out Of Prison Employment Statistics
Author
Chris Kolmar is a co-founder of Zippia and the editor-in-chief of the Zippia career advice blog. He has hired over 50 people in his career, been hired five times, and wants to help you land your next job. His research has been featured on the New York Times, Thrillist, VOX, The Atlantic, and a host of local news. More recently, he's been quoted on USA Today, BusinessInsider, and CNBC.