- Facts and Figures
- Social Security Statistics
- Social Media Statistics
- Cell Phone Usage Statistics
- Cryptocurrency Statistics
- White Collar Crime Statistics
- Crowdfunding Statistics
- Branding Statistics
- How Many Emails Are Sent Per Day
- Money Laundering Statistics
- Childcare Availability Statistics
- Cold Calling Statistics
- Automation And Job Loss Statistics
- Student Loan Statistics
- Spam Statistics
- Password Statistics
- Ransomware Statistics
- Christmas Spending Statistics
- Average Grocery Cost By State
- Average Screen Time Statistics
- Average Monthly Expenses
- IoT Statistics
- Gen Z Statistics
20 Essential Smartphone Usage Statistics [2026]: Facts, Data, and Trends on Mobile Use in the U.S.
Research Summary. In our increasingly digital world, smartphones have become indispensable tools for communication, information gathering, and entertainment. As navigation aids and social platforms, their usage continues to rise steadily.
To provide insights into smartphone usage in the U.S., we’ve compiled the most relevant statistics. According to our comprehensive research:
-
81.6% of Americans, equating to over 270 million individuals, owned a smartphone as of 2026.
-
The average American now spends 5 hours and 24 minutes on their mobile device each day.
-
On average, Americans check their phones 96 times per day, roughly once every ten minutes.
-
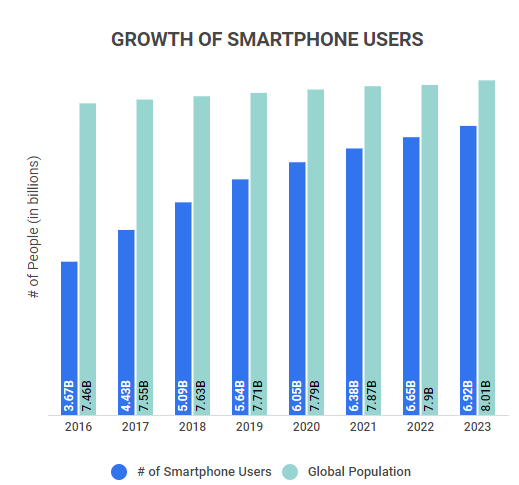
Globally, there are approximately 6.92 billion smartphone users, which constitutes about 86.29% of the world’s population as of 2026.
-
As of 2022, 59.16% of website traffic originated from mobile devices.
For a deeper understanding, we categorized the data into the following areas:
Reliance and Addictiveness | Mobile Commerce | Trends and Projections
General Smartphone Usage Statistics
With 81.6% of Americans owning smartphones, their influence on daily life is undeniable. From quick weather checks to extensive social media browsing, our findings reveal:
-
As of 2021, 90% of mobile time is spent using apps.
This is a significant increase of at least 25% compared to 2019. In fact, smartphone users logged a staggering 3.8 trillion hours on apps in 2021.
-
Between 2017 and 2022, the mobile share of internet usage rose from 51.1% to 59.1%.
In Q1 of 2015, mobile usage was just 31.16% compared to computers and other devices, but by early 2022, mobile devices became the primary means of accessing the internet.
-
17% of Americans still utilize feature phones.
While this may seem outdated, certain demographics still rely on these devices, including 25% of individuals earning less than $30,000 annually and 40% of those aged 65 and older.
-
Smartphones account for 70% of U.S. digital media time.
Categories with the highest smartphone usage include Games (94%), Social Media (92%), and Entertainment (83%). In contrast, Education (77%) and Government (72%) still rely heavily on desktop usage.
-
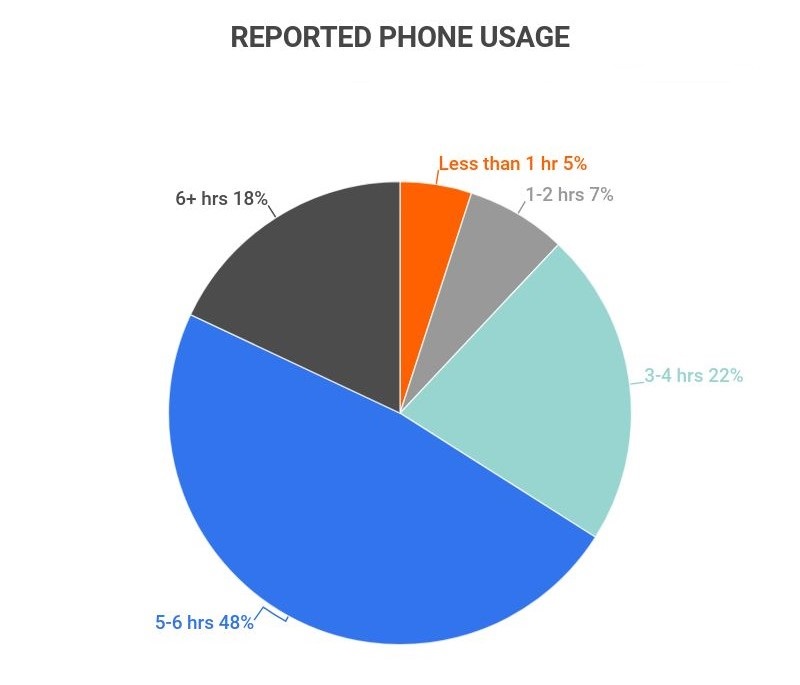
The average American spends over five hours on their phone daily.
Nearly half of Americans use their phones for five to six hours, while 22% spend three to four hours daily. Remarkably, less than 5% of Americans spend under an hour on their devices.
-
College graduates are 20% more likely to own a smartphone than those who did not graduate high school.
Overall, 93% of college graduates own smartphones, compared to 75% of individuals with some high school education. This percentage increases to 89% for those with some college experience.
Smartphone Use Statistics by Reliance and Addictiveness
The prevalence of smartphones in our lives has led to increased dependency and addiction. Here are the key statistics:
-
The average American touches their phone 2,617 times daily.
Heavy users may exceed 5,000 touches per day, which includes moments of fumbling in search of their devices. Generally, smartphone owners unlock their phones at least 150 times daily.
-
Americans check their phones every ten to 12 minutes.
This translates to an average of 96 checks per day, with 66% of Americans checking their devices around 160 times daily.
-
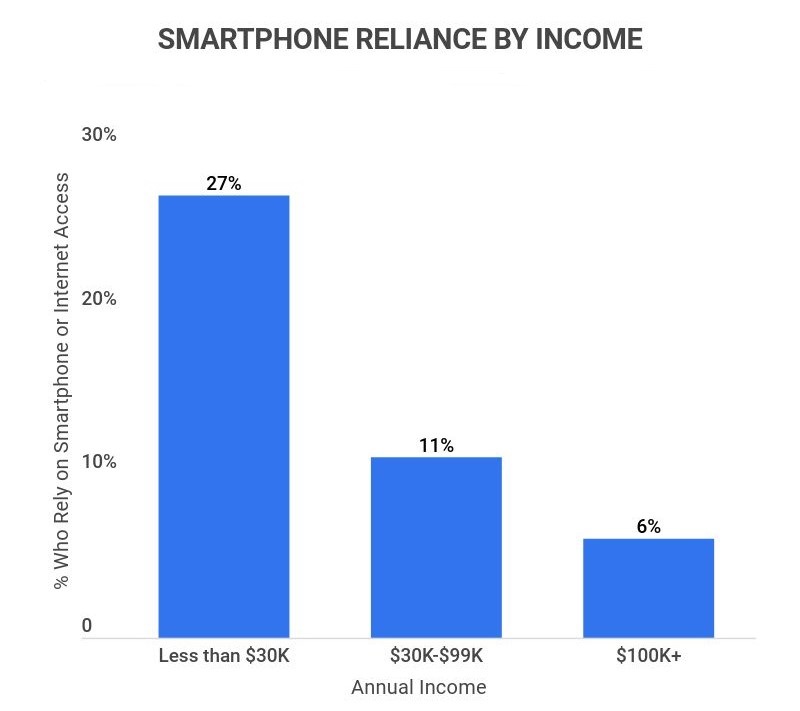
27% of Americans in households earning less than $30,000 rely on their smartphones for internet access.
This demographic represents the majority of smartphone-reliant users; however, 11% of those earning between $30,000 and $99,999 and 6% of those earning $100,000 or more also depend on their phones for connectivity.
-
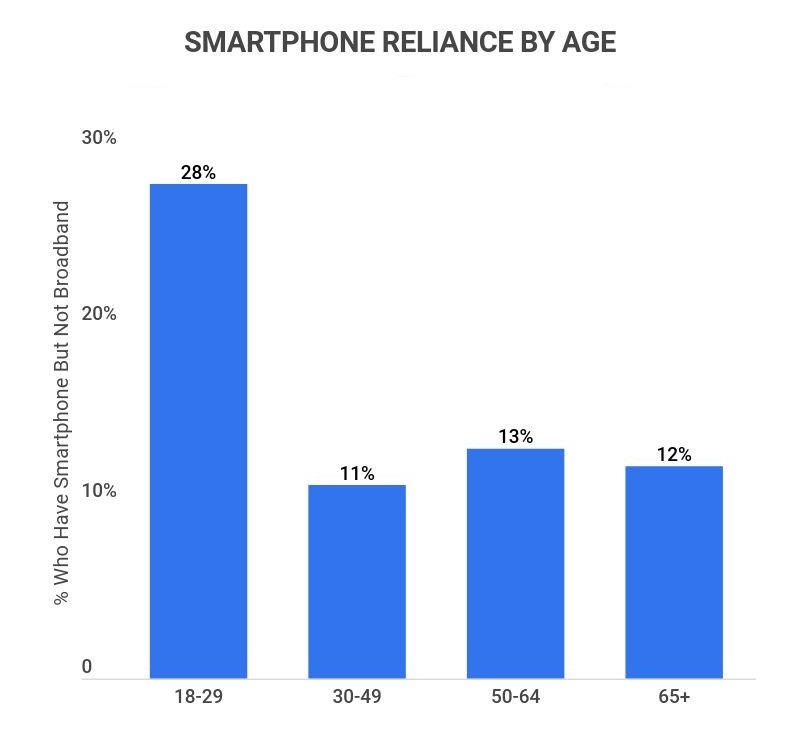
28% of individuals aged 18-29 do not have broadband but do own a smartphone.
This contrasts sharply with older generations, where broadband adoption is nearly universal. Only 11% of those aged 30-49, 13% of those aged 50-64, and 12% of individuals aged 65 and older lack broadband.
Smartphone Usage Statistics and Mobile Commerce
The rise of smartphones has significantly impacted mobile commerce, particularly in the U.S., where this sector is thriving. Our research indicates:
-
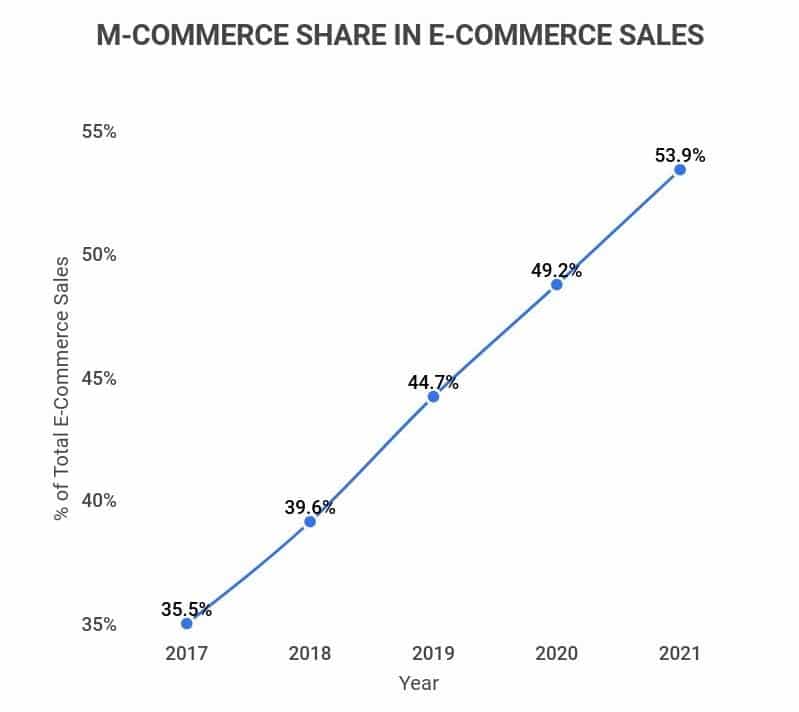
As of 2021, the m-commerce sector accounted for nearly 73% of total e-commerce.
This marks a 39.1% increase from 2016 when m-commerce comprised 52.4% of e-commerce. The growing reliance on mobile devices indicates this trend will likely continue.
-
79% of smartphone users have made purchases using their mobile devices.
The average mobile purchase amounts to $94.85, prompting businesses to focus increasingly on mobile apps and m-commerce marketing strategies.
-
U.S. m-commerce is projected to experience a remarkable CAGR of 34.9% from 2020 to 2026.
This growth is driven by the increase in smartphone users and a rising segment of the population relying solely on their phones for internet access.
-
In 2020, U.S. m-commerce generated annual revenue of $339.03 billion.
This figure represents approximately 11-12% of the global m-commerce revenue.
Smartphone Usage Statistics: Trends and Projections
Smartphone usage is expected to keep rising, driven by various factors. Key trends and projections include:
-
Year-over-Year (YoY) growth for cell phone usage is forecasted to remain stable at 2-3% through 2025.
This translates to nearly a billion new users. As of 2023, there are 6.92 billion smartphone users globally, projected to reach 7.34 billion by 2025.
-
Time spent using smartphone apps in the U.S. has surged by 25% since 2019.
Globally, this number is even higher at 30%, with countries like India (80%) and Russia (50%) experiencing the most substantial increases.
-
By 2025, an estimated 72.6% of global smartphone owners will access the internet exclusively through their devices.
This indicates over 1.3 billion individuals worldwide will rely solely on smartphones for internet access.
-
There are approximately 10.37 billion mobile connections globally.
This means there are 2.46 billion more mobile connections than people, representing a 24% surplus in mobile connections worldwide.
-
By 2026, there will be an estimated 7.52 billion smartphone users.
This reflects a 12% increase from current figures, indicating healthy growth as 86% of the global adult population already owns a smartphone.
-
Since 2016, the number of smartphone users worldwide has expanded by 50%.
In 2016, there were only 3.67 billion users, making up 45% of the population, while as of 2022, this figure has risen to encompass 86% of the global population.
Cell Phone Usage Statistics FAQ
-
What is the average cell phone usage per day in 2022?
As of 2022, the average American uses their phone for at least five hours and 24 minutes per day. More specifically, just under half of all Americans spend between five to six hours on their phones per day, while a further 22% spend three to four hours on average on their phones daily. Less than 5% of Americans spend less than an hour on their phones per day.
-
What percentage of the world has a cell phone in 2022?
A substantial 86% of the global population has a smartphone in 2022. This is remarkable, considering that in 2016, the number of global smartphone users was only 3.67 billion, which was 45% of the total population.
Moreover, the prevalence of smartphones is projected to continue growing, with estimates of 7.52 billion smartphone users by 2026—12% more than the current 6.92 billion.
-
How many times does someone check their phone a day in 2022?
The average American checks their phone 96 times per day, or approximately once every ten to 12 minutes. On average, we touch our phones up to 2,617 times per day and unlock our phones 150 times. This illustrates significant engagement with our devices.
-
How many smartphones are sold each year?
Globally, over 1.5 billion smartphones are sold annually. Samsung remains the leading manufacturer, with 272 million smartphones sold in 2021. Other major players include Apple, Xiaomi, OPPO, and Vivo, all reaching record-high shipments during that year.
-
How many Americans have smartphones?
81.6% of Americans own smartphones, which translates to over 270 million people. This trend is expected to rise, as 53% of American children now receive smartphones before the age of 11.
-
What percentage of people are addicted to their phones?
47% of individuals feel they are addicted to their smartphones. Symptoms of this addiction include that 74% of Americans feel anxious when leaving home without their phones, 71% check their phones within the first 10 minutes of waking up, and 70% check their devices within the first five minutes of receiving notifications.
These trends indicate a profound reliance on smartphones, suggesting many people struggle to disconnect from their devices.
Conclusion
Smartphones have become ubiquitous in today’s society, with 81.6% of Americans owning these essential devices and 86.29% of the global population following suit.
Our reliance on smartphones is evident, as we check them every ten to twelve minutes and spend an average of over five hours daily on these devices. Notably, over a quarter of individuals earning under $30,000 annually and a similar percentage of those aged 18-29 depend on their smartphones for internet access.
This trend shows no signs of slowing down, with the U.S. e-commerce market projected to exhibit a robust CAGR of 34.9% between 2020 and 2026. Additionally, time spent on smartphone apps in the U.S. has increased by 25% since 2019.
Considering the anticipated 12% growth in global smartphone users by 2026, it’s clear that smartphones will continue to dominate our daily lives.
Sources:
-
Forbes. “Record 3.8 Trillion Hours Spent On Mobile Apps During 2021 In Another Blockbuster Year For Digital Economy.” Accessed on January 24th, 2021.
-
The Motley Fool. “A Foolish Take: 17% of Americans Use Feature Phones.” Accessed on January 24th, 2021.
-
Marketing Charts. “Smartphones Now Account for 70% of US Digital Media Time.” Accessed on January 24th, 2021.
-
Statista. “How much time on average do you spend on your phone on a daily basis?” Accessed on January 24th, 2021.
-
Dscout. “Putting a Finger on Our Phone Obsession.” Accessed on January 24th, 2021.
-
Fox 13. “Americans check their smartphones 96 times a day, survey says.” Accessed on January 24th, 2021.
-
Pew Research Center. “Digital divide persists even as Americans with lower incomes make gains in tech adoption.” Accessed on January 24th, 2021.
-
Pew Research Center. “Mobile Fact Sheet.” Accessed on January 24th, 2021.
-
Oberlo. “Mobile Commerce Sales in 2021.” Accessed on January 24th, 2021.
-
Appinventiv. “Future of Mobile Commerce: Stats & Trends to Know in 2021-2025.” Accessed on January 24th, 2021.
-
Statista. “Number of smartphone users from 2016 to 2021.” Accessed on January 24th, 2021.
-
TechCrunch. “Consumers now average 4.2 hours per day in apps, up 30% from 2019.” Accessed on January 24th, 2021.
-
CNBC. “Nearly three quarters of the world will use just their smartphones to access the internet by 2025.” Accessed on January 24th, 2021.
-
Statista. “Percentage of mobile device website traffic worldwide from 1st quarter 2015 to 4th quarter 2022.” Accessed on April 3, 2023.
-
BankmyCell. “How Many Smartphones Are in the World?” Accessed on April 3, 2023.
- Facts and Figures
- Social Security Statistics
- Social Media Statistics
- Cell Phone Usage Statistics
- Cryptocurrency Statistics
- White Collar Crime Statistics
- Crowdfunding Statistics
- Branding Statistics
- How Many Emails Are Sent Per Day
- Money Laundering Statistics
- Childcare Availability Statistics
- Cold Calling Statistics
- Automation And Job Loss Statistics
- Student Loan Statistics
- Spam Statistics
- Password Statistics
- Ransomware Statistics
- Christmas Spending Statistics
- Average Grocery Cost By State
- Average Screen Time Statistics
- Average Monthly Expenses
- IoT Statistics
- Gen Z Statistics
Author
Jack Flynn is a writer for Zippia. In his professional career he’s written over 100 research papers, articles and blog posts. Some of his most popular published works include his writing about economic terms and research into job classifications. Jack received his BS from Hampshire College.