- Tech Industry Statistics
- MFA Statistics
- Streaming Services Statistics
- Mobile Vs. Desktop Usage Statistics
- AI Statistics
- Live Streaming Statistics
- Zoom Meeting Statistics
- Cord Cutting Statistics
- Digital Transformation Statistics
- Virtual Reality Statistics
- How Fast Is Technology Advancing
- Mobile Commerce Statistics
- SaaS Statistics
- Machine Learning Statistics
- Diversity In High Tech
- Cyber Security Statistics
- Ecommerce Statistics
- Tech Industry
- Gaming Industry
- Renewable Energy Job Creation
- Smartphone Industry
- Cybercrime Statistics
- Amazon Statistics
- Personalization Statistics
23 Incredible Cord Cutting Statistics [2026]: Why Americans Are Moving Away From Cable
Research Summary. The shift from traditional cable and satellite TV to online streaming services has become a defining trend in the media landscape. As consumer preferences evolve, more people are opting to “cut the cord.” Here are key statistics that highlight the cord-cutting phenomenon.
-
An estimated 5.9 million households intended to end their cable subscriptions by the end of 2025.
-
Approximately 5.2 million people cut the cord in 2025.
-
Since 2012, cable providers have lost around 30 million subscribers.
-
Adults aged 18 to 29 are the largest demographic without cable, with 38% of them not subscribing to traditional TV services.
-
Projections indicate a 9% decline in cable and satellite TV penetration rates by 2030.
-
U.S. streaming service revenues have increased by 400% from 2015 to 2025.
For a more detailed analysis, we have categorized the data in the following ways:
Demographics | Projections | Cable Industry | Streaming Services

General Cord Cutting Statistics
-
52% of Americans say they watch cable or satellite TV, according to a recent survey.
This represents a decline from 76% in 2015.
Among those without cable or satellite subscriptions, 72% claim they can find the content they desire online, and 68% state that cable subscriptions are too expensive.
-
32% of U.S. households intended to cut the cord by the end of 2025.
In comparison, 15% of U.S. households canceled their cable and satellite subscriptions in 2020.
-
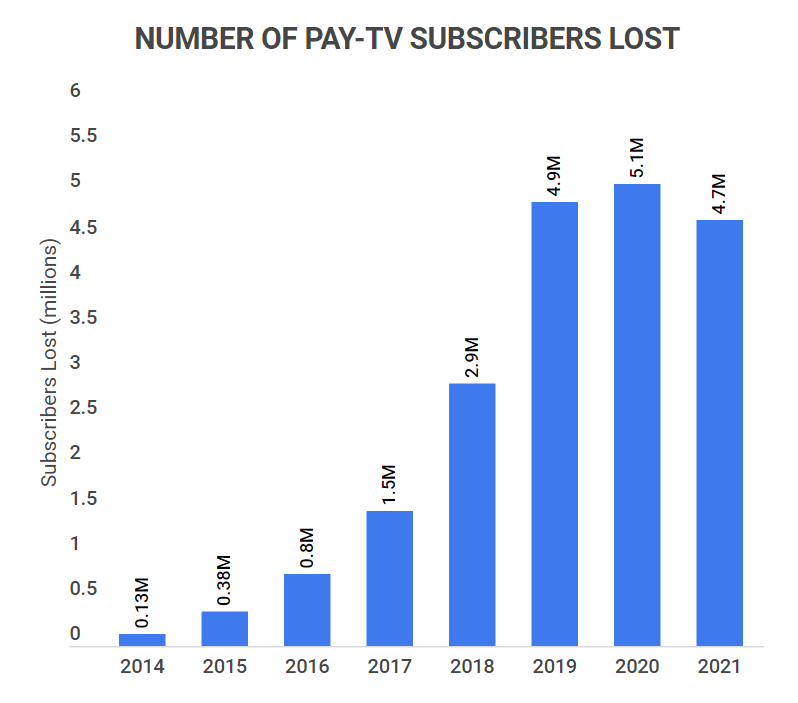
In 2025, pay-TV providers lost 5.3 million subscribers.
Here’s the breakdown of subscriber losses from 2014 to 2025:
Number of Pay-TV Subscribers Lost
Year Number of Subscribers Lost 2025 5.3 million 2024 5.7 million 2023 5.1 million 2022 4.9 million 2021 4.7 million 2020 5.1 million 2019 4.9 million 2018 2.9 million 2017 1.5 million 2016 0.8 million 2015 0.4 million 2014 0.1 million
Cord Cutting Statistics by Demographics
-
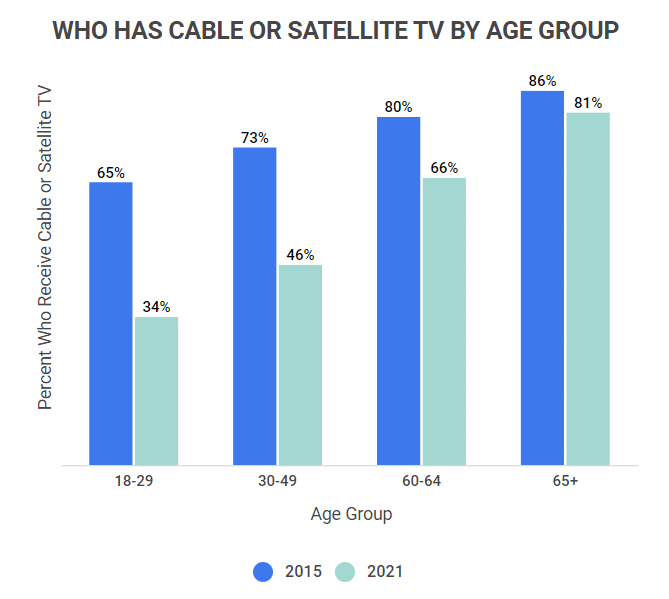
U.S. adults aged 65 and older still hold the largest share of cable and satellite TV subscriptions.
79% of this age group receive their TV via cable or satellite, which is higher than the 52% of all U.S. adults who use these services.
The breakdown of other age demographics is as follows:
Percent of Who Receives Cable or Satellite TV By Age Group
Age Group Receive Cable or Satellite TV (2015) Receive Cable or Satellite TV (2025) Change (%) 18-29 65% 38% -27% 30-49 73% 49% -24% 50-64 80% 68% -12% 65+ 86% 79% -7% -
About 45% of adults aged 18 to 29 have never subscribed to cable or satellite TV.
This demographic represents a significant portion of those who view streaming as a viable alternative, with 93% stating they can find the content they want online.
-
75% of U.S. adults over the age of 50 who have cut the cord cite cost as their primary reason.
This sentiment is echoed by 68% of adults aged 30-49 and 62% of those aged 18-29.
Cord-Cutting Statistics By Projections
-
It is estimated that a total of 5.2 million people will cut the cord in 2025, bringing the total number of cord-cutters up to 60 million (or approximately 22% of the U.S. adult population).
-
Approximately 11% of current cable and satellite TV subscribers are projected to cut the cord in 2025.
-
Subscriber numbers for cable TV are expected to decrease from 71 million in 2020 to 56 million by 2026.
-
The streaming service industry revenue reached around $230 billion in 2025, with expectations to hit $300 billion by 2030, nearly doubling within five years.
-
The cable and satellite TV penetration rate in U.S. households is projected to decline from 85% in 2017 to 79% in 2030.
-
The global streaming services industry is anticipated to grow at a CAGR of 21% from 2021 to 2028.
Cord Cutting Statistics By the Cable Industry
-
Comcast remains the leading cable TV provider with 18.5 million subscribers.
AT&T Premium TV follows with 16 million subscribers, while Charter Spectrum and Dish Network have 14 million and 9 million subscribers, respectively.
-
As of December 2025, the U.S. has about 66 million cable TV subscribers.
No single provider has more than 20 million subscribers, and this trend of decline is expected to continue.
-
In 2025, consumers are paying an average of $95 per month for cable TV.
It is estimated that cord-cutters save an average of $90 a month by relinquishing their cable subscriptions.
Cord Cutting Statistics and Streaming Services
-
In 2025, U.S. video streaming apps generated $36 billion in revenue.
This reflects a significant increase from $7.1 billion in 2015.
-
Disney+ continues to be the fastest-growing streaming service.
Since its launch in November 2019, it has amassed over 200 million subscribers.
-
Netflix, Amazon Prime Video, Disney+, Apple TV+, and Hulu are among the five largest video streaming platforms.
Here are their subscriber counts:
Streaming App Number of Subscribers Netflix 100 million Prime Video 60 million Disney+ 55 million Apple TV+ 50 million Hulu 45 million Peacock 20 million YouTube Premium 20 million HBO Max 10 million ESPN+ 10 million CBS All Access 6 million -
40% of those who do not subscribe to cable or satellite TV have never done so.
This indicates that a significant portion of cord-cutters have never engaged with traditional cable services. This group constitutes about 18% of all U.S. adults, while 27% are actual cord-cutters.
-
80% of U.S. households now subscribe to Netflix, Amazon Prime, or Hulu.
Moreover, 60% of these households have subscriptions to multiple platforms, reflecting an increase from 43% in 2018.
Cord-Cutting Statistics FAQ
-
Is cable TV losing subscribers?
Yes, cable TV is losing subscribers. In 2025, the number of cable TV subscribers is projected to fall to 56 million, down from about 71 million in 2020.
Only 52% of Americans watched cable or satellite TV in 2025, with 32% of U.S. households indicating their intention to cancel such subscriptions. This is a stark contrast from 76% in 2015 and 15% in 2020.
Moreover, young adults are opting for alternatives, with 45% of U.S. adults having never subscribed to cable or satellite TV.
-
How many people cut the cord every year?
Since 2021, about 5 million people have cut the cord annually. In recent years, the numbers have fluctuated slightly, with 5.2 million expected to cut the cord in 2025.
This trend reflects a growing preference for streaming services, as 80% of U.S. households subscribe to at least one major platform.
-
Yes, the cable industry is experiencing decline. With projections estimating a drop from 71 million subscribers in 2020 to 56 million by 2026, the industry faces significant challenges.
As the penetration rate of cable and satellite TV is expected to fall to 79% by 2030, streaming services present a growing competitive threat.
-
Are streaming services more popular than cable?
Yes, streaming services have surpassed cable in popularity. While 52% of Americans still watch cable or satellite TV, 80% of U.S. households now subscribe to streaming services.
Notably, just 38% of adults aged 18 to 29 have cable subscriptions compared to 79% of those aged 65 and older.
Conclusion
The cable and satellite TV industry remains present, but online streaming platforms continue to dominate. By 2025, 32% of U.S. households planned to cut the cord, a significant increase from previous years.
Moreover, 80% of U.S. households are now subscribing to streaming services like Netflix, Amazon Prime, or Hulu, with many households opting for multiple subscriptions. Comparatively, only 52% of Americans watch cable or satellite TV.
Cost-effectiveness and content availability are the primary drivers behind this shift, with 72% of viewers preferring streaming for its vast content libraries and lower costs.
References
-
Pew Research Center. “Cable and Satellite TV Use Has Dropped Dramatically in the U.S. Since 2015.” Accessed on February 23, 2022.
-
Forbes. “Cord-Cutting To Accelerate in 2021, with 27% of Cable Households Disconnecting.” Accessed on February 23, 2022.
-
Finances Online. “Number of U.S. Households in 2022/2023: Demographics, Statistics, & Trends.” Accessed on February 23, 2022.
-
Statista. “Number of Net Subscriber Losses Among Pay TV Providers in the United States From 2014 to 2020.” Accessed on February 23, 2022.
-
Insider Intelligence. “U.S. Cord-Cutters, 2017-2022 (Millions, % Change and % of Population).” Accessed on February 23, 2022.
-
Fortune. “Why Cord Cutters Actually Are Saving a Huge Amount Over Cable Subscribers.” Accessed on February 23, 2022.
-
Statista. “Pay TV Providers Ranked by the Number of Subscribers in the United States as of December 2020.” Accessed on February 23, 2022.
-
Broadband Communities Magazine. “Streaming Is Killing Broadcast TV.” Accessed on February 23, 2022.
-
PR Newswire. “TDG: Virtual MVPDs To Disrupt Pay-TV Marketplace, Legacy Services to Lose 26% of Subscribers by 2030.” Accessed on February 23, 2022.
-
PR Newswire. “Global Video Streaming Market Is Projected To Grow with a CAGR of 21.0% During 2021-2028 | Up Market Research.” Accessed on February 23, 2022.
-
Business of Apps. “Video Streaming App Revenue and Usage Statistics (2022).” Accessed on February 23, 2022.
-
Insider. “The Best Streaming Services You Can Sign Up For in 2022.” Accessed on February 23, 2022.
-
Deadline. “More Than Half of U.S. Households Now Subscribe To Multiple Streaming Services, Study Finds.” Accessed on February 23, 2022.
- Tech Industry Statistics
- MFA Statistics
- Streaming Services Statistics
- Mobile Vs. Desktop Usage Statistics
- AI Statistics
- Live Streaming Statistics
- Zoom Meeting Statistics
- Cord Cutting Statistics
- Digital Transformation Statistics
- Virtual Reality Statistics
- How Fast Is Technology Advancing
- Mobile Commerce Statistics
- SaaS Statistics
- Machine Learning Statistics
- Diversity In High Tech
- Cyber Security Statistics
- Ecommerce Statistics
- Tech Industry
- Gaming Industry
- Renewable Energy Job Creation
- Smartphone Industry
- Cybercrime Statistics
- Amazon Statistics
- Personalization Statistics
Author
Abby is a writer who is passionate about the power of story. Whether it’s communicating complicated topics in a clear way or helping readers connect with another person or place from the comfort of their couch. Abby attended Oral Roberts University in Tulsa, Oklahoma, where she earned a degree in writing with concentrations in journalism and business.