- Tech Industry Statistics
- MFA Statistics
- Streaming Services Statistics
- Mobile Vs. Desktop Usage Statistics
- AI Statistics
- Live Streaming Statistics
- Zoom Meeting Statistics
- Cord Cutting Statistics
- Digital Transformation Statistics
- Virtual Reality Statistics
- How Fast Is Technology Advancing
- Mobile Commerce Statistics
- SaaS Statistics
- Machine Learning Statistics
- Diversity In High Tech
- Cyber Security Statistics
- Ecommerce Statistics
- Tech Industry
- Gaming Industry
- Renewable Energy Job Creation
- Smartphone Industry
- Cybercrime Statistics
- Amazon Statistics
- Personalization Statistics
Tech industry research summary: The tech industry has significantly evolved in recent years, becoming integral to virtually every aspect of work, education, and daily living. As we step into 2026, understanding the current state and potential of the tech sector is crucial.
To gain insights into the tech industry’s market value and demographic landscape, we have compiled the latest statistics. Based on our thorough research:
-
The U.S. tech industry is projected to reach a market value of $2.1 trillion by the end of 2025.
-
Approximately 300,000 tech industry jobs were added in 2025.
-
The U.S. tech sector represents around 37% of the global tech market.
-
The U.S. tech industry is anticipated to grow by 5.8% in 2026.
-
As of 2025, the tech industry employs approximately 13.5 million workers.
-
There are over 600,000 tech companies operating in the U.S.
For further insights, we have categorized the data as follows:
Employers + Employees | Employee Demographics | Trends

Tech industry and U.S. economy statistics
With 13.5 million tech workers, it’s clear that the tech industry’s influence on the U.S. economy is substantial. To understand this impact better, we’ve compiled some pertinent statistics:
-
Net tech employment comprises 8.2% of the total U.S. workforce.
This figure includes about 7.9 million tech industry jobs, as well as positions in tech-related occupations, reflecting a remarkable recovery and growth trajectory post-pandemic.
-
The tech industry accounted for over 11% of the total U.S. GDP in 2025.
This figure shows consistent growth over the years, as the sector has consistently contributed a significant share of the GDP.
-
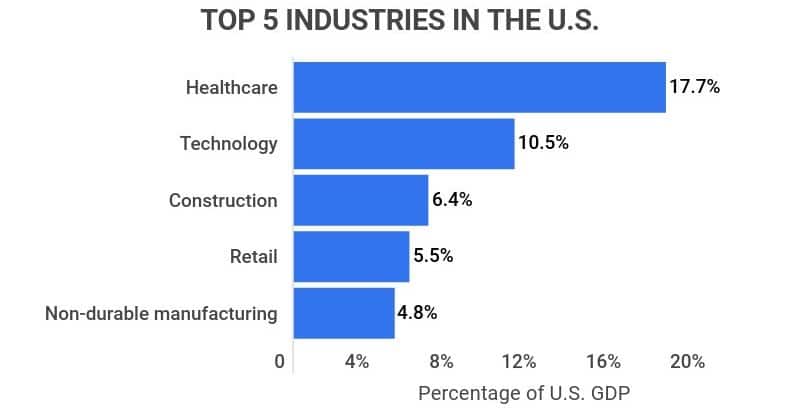
The tech industry ranks second in driving the U.S. economy.
It surpasses sectors like construction, retail, and non-durable manufacturing, with retail contributing 5.7% and non-durable manufacturing 5.1% to the GDP.
-
Tech employees earn up to 90% more than those in other sectors.
This wage disparity is particularly pronounced in tech hubs like San Jose, California, where tech workers can earn up to 500% more than the area average.
-
North America, Asia, and Europe dominate the global IT industry.
North America holds 37% of the market share, followed by Asia at 30%, and Europe at 22%. While emerging markets in Africa and Latin America are gaining ground, established regions continue to expand.
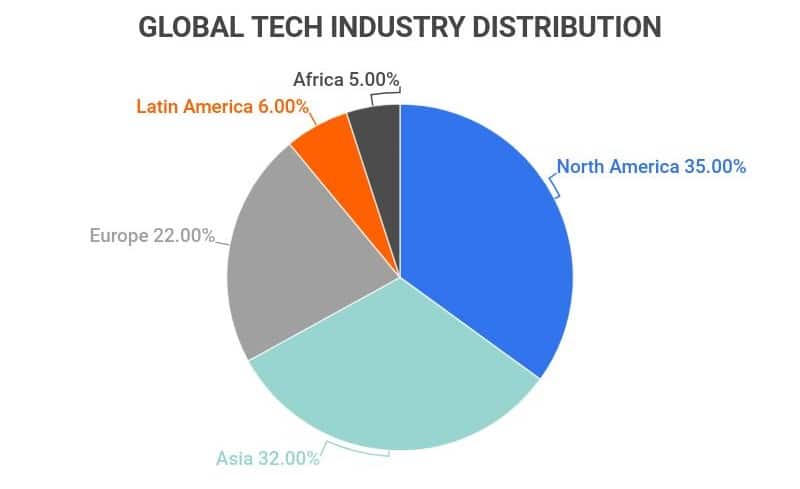
Overall, the global tech industry is valued at approximately $6 trillion.
Tech industry statistics by employers and employees
Given the tech sector’s economic importance, it’s no surprise that numerous major tech companies operate in the U.S. Here are some key insights into these companies and their employees:
-
The average salary for a tech industry professional in the U.S. is $77,000.
This is around $25,000 more than the average American salary, which is $52,000 a year. Even entry-level tech positions offer an average starting salary of $58,000, exceeding the overall average.
-
Amazon, Apple, Google, and Facebook, collectively known as the “Big Four,” are valued at $4.5 trillion.
These companies employ approximately 1.75 million people, with Amazon alone accounting for about 1.4 million employees.
-
There are at least 600,000 tech companies in the U.S.
This is significant, considering the ‘Big Four’ and Microsoft together represent around 25% of the total market.
-
The largest tech acquisition of 2021 was Microsoft’s purchase of Nuance for $19.7 billion.
Other notable acquisitions included Nvidia’s acquisition of ARM for $40 billion and Salesforce’s purchase of Slack for $27.7 billion. These companies continue to show robust market performance.
Tech industry statistics by employee demographics
The tech industry employs a diverse workforce, but understanding the demographic composition can shed light on existing disparities. Here are the key statistics:
-
Massachusetts maintains the highest proportion of tech workers, with about 6% of its population employed in the tech sector.
While Massachusetts has around 450,000 tech workers compared to California’s 1.9 million, its smaller population results in a higher percentage of tech employment.
-
As of 2025, 72% of tech industry workers are men.
Conversely, women represent only 28% of the workforce, and the disparity is still significant. For instance, female workers earn on average $4,000 less per year compared to their male counterparts in tech roles.
-
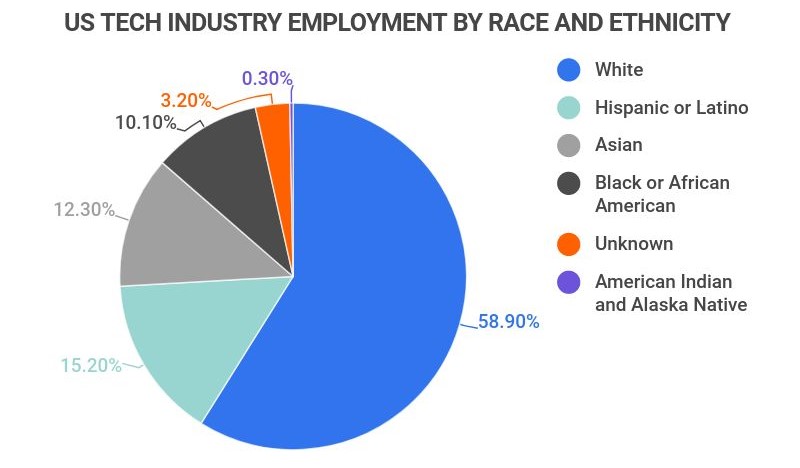
Despite making up only 5.4% of the U.S. population, Asians constitute 11.1% of tech industry workers.
This trend is further highlighted by salary differences, as the average Asian tech worker earns over $8,000 more than their white counterparts and more than $10,000 more than their Black counterparts.
-
White individuals continue to be the most represented demographic in the U.S. tech industry, comprising 60% of the workforce.
This figure has slightly declined from 63.89% in 2010, indicating a gradual shift in workforce diversity.
-
Despite representing 12.1% of the U.S. population, Black workers make up only 9.9% of tech industry employees.
This gap underscores ongoing diversity challenges within the sector. Notably, Black workers tend to have the lowest salaries, averaging $62,000.
-
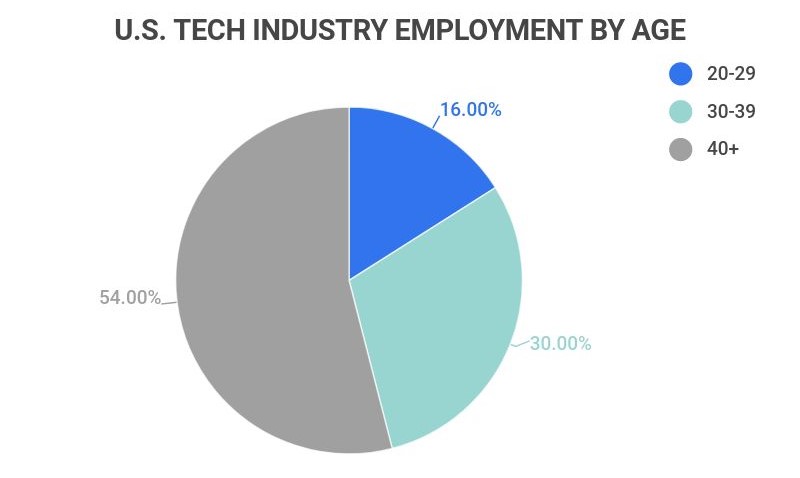
55% of tech employees are aged 40 and older.
This demographic represents the largest segment of the workforce, with only 28% of employees aged 30-40 and 17% aged 20-30, indicating a mature workforce in the tech sector.
Top ten states by net tech employment
| State | Net Tech Employment |
|---|---|
| California | 1,900,000 |
| Texas | 1,200,000 |
| New York | 700,000 |
| Florida | 600,000 |
| Virginia | 480,000 |
| Pennsylvania | 470,000 |
| Illinois | 450,000 |
| Massachusetts | 440,000 |
| Michigan | 420,000 |
| Ohio | 410,000 |

Male vs. female tech workers over time
| Year | Male | Female |
|---|---|---|
| 2025 | 72.00% | 28.00% |
| 2024 | 72.74% | 27.26% |
| 2023 | 74.50% | 25.50% |
| 2022 | 75.98% | 24.02% |
| 2021 | 77.22% | 22.78% |
| 2020 | 76.53% | 23.47% |
| 2019 | 76.62% | 23.38% |
| 2018 | 76.49% | 23.51% |
| 2017 | 74.79% | 25.21% |
| 2016 | 74.42% | 25.58% |
| 2015 | 73.90% | 26.10% |
| 2014 | 72.49% | 27.51% |
| 2013 | 71.51% | 28.49% |
Tech industry trends and predictions
The tech sector, still relatively nascent, has profoundly influenced the U.S. economy and daily life. Below are key trends shaping the industry:
-
Today, over 92% of Americans have internet access.
This statistic marks a significant rise from just 50% in 2000, showcasing the rapid digital transformation over the years.
-
The U.S. tech industry is projected to maintain a CAGR of 5.5% through 2026.
This growth rate, while stable, does not capture the fastest-growing segments, such as the Augmented Reality (AR) market, which is expected to grow at a staggering CAGR of 105% from 2021 to 2026.
-
88% of businesses anticipate that AI will enhance their competitive edge.
However, 24% of executives also admit that workforce reduction is a likely outcome of AI adoption.
-
The cloud computing sector is forecasted to experience a CAGR of 19% by 2026.
This represents significant potential, as the sector was valued at $410 billion in 2020 and could reach approximately $1 trillion by 2026.
Tech industry statistics FAQ
-
How much is the tech industry worth?
As of 2025, the global tech industry is valued at approximately $6 trillion. The market share is primarily distributed between North America (37%), Asia (30%), and Europe (22%). The U.S. tech sector alone is worth about $2.1 trillion, accounting for roughly 10.8% of the U.S. total GDP.
-
What is the growth rate of the tech industry?
The overall tech industry is expected to maintain a CAGR of 5.5% through 2026. However, certain sectors, like Augmented Reality (AR), are anticipated to grow at a CAGR of 105% by 2026, while the cloud computing sector is expected to see a CAGR of 19% by the same year.
Furthermore, the tech industry’s growth has significantly impacted the American populace; for instance, internet access has skyrocketed from 50% in 2000 to over 92% today.
-
Which tech sectors are growing the fastest?
The fastest-growing tech sectors include Blockchain DeFi, Artificial Intelligence (AI), and Virtual Reality/Augmented Reality (AR/VR).
Blockchain DeFi is projected to have a CAGR of 68% through 2026, with AI growing at 41%, and AR/VR seeing an impressive CAGR of 105%.
-
How many jobs are available in technology?
As of 2025, there are approximately 4.5 million tech jobs available in the U.S. This number is on the rise, with around 300,000 new tech jobs added in 2025 alone, indicating a robust job market in the sector.
Conclusion
With a contribution of over 11% to the total U.S. GDP, the significance of the U.S. tech industry cannot be overstated. It represents 37% of the global market and has played a pivotal role in increasing internet access dramatically in the past two decades.
As we navigate through 2026, the U.S. tech industry remains resilient, with an overall CAGR projected at 5.5%. Emerging technologies like Blockchain DeFi, Artificial Intelligence (AI), and Virtual Reality/Augmented Reality (AR/VR) are leading the charge in innovation and growth. Notably, the average tech employee earns about $25,000 more annually than the average American.
Nonetheless, disparities persist, with male, white, and Asian employees dominating the workforce and earning significantly more than their female, Black, and Hispanic counterparts. This highlights the ongoing diversity challenges within the industry.
Fortunately, the addition of 300,000 new jobs in 2025 reflects a promising trajectory for the tech sector.
References
-
CompTIA. “State of the Tech Workforce Cyberstates 2025.” Accessed on November 3rd, 2025.
-
Statista. “Tech sector as a percentage of total gross domestic product (GDP) in the United States from 2021 to 2025.” Accessed on November 3rd, 2025.
-
Investopedia. “The 5 Industries Driving the U.S. Economy.” Accessed on November 3rd, 2025.
-
TechRepublic. “Tech professionals make up to 90% more than state averages in other industries.” Accessed on November 3rd, 2025.
-
TechRepublic. “US tech industry had 13.5 million employees in 2025.” Accessed on November 4th, 2025.
-
Zippia. “Information Technology Professional Demographics And Statistics In The US.” Accessed on November 4th, 2025.
-
World Economic Forum. “How has technology changed and changed us in the past 20 years?” Accessed on November 4th, 2025.
-
CompTIA. “IT Industry Outlook 2025.” Accessed on November 4th, 2025.
-
Forbes. “How Artificial Intelligence Is Revolutionizing Business.” Accessed on November 4th, 2025.
-
Yahoo!. “14 Best Cloud Computing Stocks To Invest In.” Accessed on November 4th, 2025.
-
BBC. “How much power does tech ‘big four’ have?” Accessed on November 4th, 2025.
-
New York Times. “Big Tech’s Domination of Business Reaches New Heights.” Accessed on November 4th, 2025.
-
ComputerWorld. “Biggest technology acquisitions of 2021.” Accessed on November 4th, 2025.
- Tech Industry Statistics
- MFA Statistics
- Streaming Services Statistics
- Mobile Vs. Desktop Usage Statistics
- AI Statistics
- Live Streaming Statistics
- Zoom Meeting Statistics
- Cord Cutting Statistics
- Digital Transformation Statistics
- Virtual Reality Statistics
- How Fast Is Technology Advancing
- Mobile Commerce Statistics
- SaaS Statistics
- Machine Learning Statistics
- Diversity In High Tech
- Cyber Security Statistics
- Ecommerce Statistics
- Tech Industry
- Gaming Industry
- Renewable Energy Job Creation
- Smartphone Industry
- Cybercrime Statistics
- Amazon Statistics
- Personalization Statistics
Author
Jack Flynn is a writer for Zippia. In his professional career he’s written over 100 research papers, articles and blog posts. Some of his most popular published works include his writing about economic terms and research into job classifications. Jack received his BS from Hampshire College.