- Tech Industry Statistics
- MFA Statistics
- Streaming Services Statistics
- Mobile Vs. Desktop Usage Statistics
- AI Statistics
- Live Streaming Statistics
- Zoom Meeting Statistics
- Cord Cutting Statistics
- Digital Transformation Statistics
- Virtual Reality Statistics
- How Fast Is Technology Advancing
- Mobile Commerce Statistics
- SaaS Statistics
- Machine Learning Statistics
- Diversity In High Tech
- Cyber Security Statistics
- Ecommerce Statistics
- Tech Industry
- Gaming Industry
- Renewable Energy Job Creation
- Smartphone Industry
- Cybercrime Statistics
- Amazon Statistics
- Personalization Statistics
Research Summary. In the ever-evolving landscape of media consumption, streaming services have become a cornerstone of entertainment for millions across the globe. As we enter 2026, the surge in users and revenue for video and music streaming platforms underscores their significance in our daily lives.
-
83% of Americans now have at least one streaming subscription as of 2025.
-
The average American subscriber enjoys four paid streaming services.
-
U.S. video streaming apps generated a remarkable $30.8 billion in revenue in 2022.
-
The leading paid video streaming service globally remains Netflix, with 221 million subscribers worldwide.
-
In 2022, Netflix allocated an impressive $19 billion (approximately 48% of their annual budget) towards original content.
-
The most popular free (and paid) video streaming service globally is still YouTube, boasting over 3 billion active users.
-
The streaming service industry is on track to reach a revenue of $150 billion by 2026.
For further analysis, we broke down the data in the following ways:
Music | Demographic | Trends and Projections

Video Streaming Statistics by Company
-
The top video streaming apps include YouTube, Amazon Prime Video, Netflix, HBO Max, Disney+, Hulu, Apple TV+, ITV Hub, BBC iPlayer, and Peacock.
Collectively, these platforms boast billions of users.
YouTube leads with over 3 billion active users, followed by:
-
Amazon Prime Video with 200 million users
-
Netflix with 221 million users
-
HBO Max with 80 million users
-
Disney+ with 75 million users
-
Hulu with 45 million users
-
Apple TV+ with 42 million users
-
ITV Hub with 30 million users
-
BBC iPlayer with 11 million users
-
Peacock with 10 million users
-
-
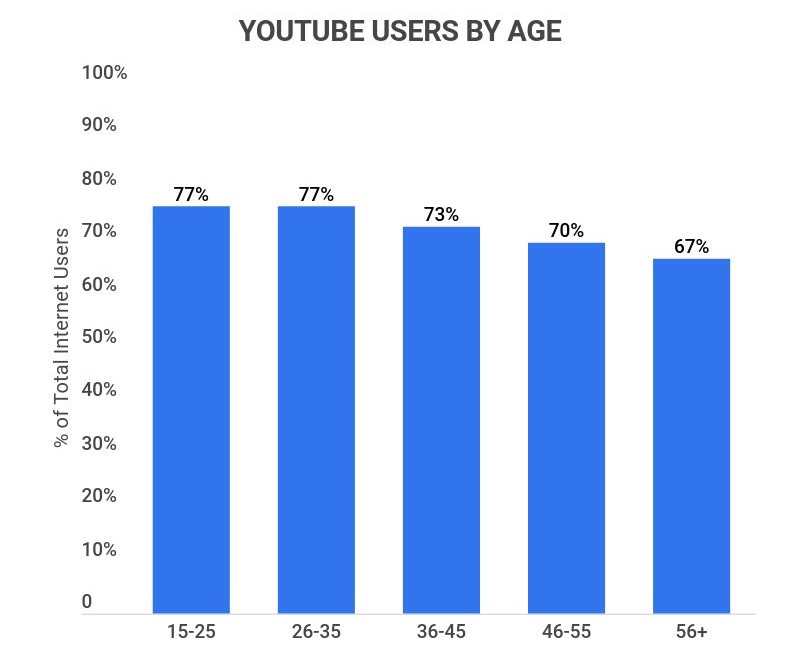
YouTube has 130 million unique users every month in the United States.
This makes YouTube the most popular video streaming service in the U.S.
-
YouTube now has over 4 million paid subscribers as of 2022.
Additionally, YouTube’s ad revenue reached $6 billion in the same year, reflecting a significant increase.
-
Approximately 55% of Americans have a Netflix subscription as of 2022.
Alternatively, 12% of Americans previously had a Netflix account but no longer maintain one.
-
In 2022, Netflix gained 15 million new subscribers worldwide.
While still a substantial number, it marks a downturn compared to previous years, reflecting a competitive market.
-
There are 80 million Netflix subscribers in the United States and Canada.
These North American countries constitute the largest demographic of Netflix users globally.
Music Streaming Statistics
-
By 2022, global music streaming revenues reached $15 billion.
-
Approximately 85% of music industry revenue now comes from streaming.
-
Spotify boasts 220 million paid subscribers as of 2022.
-
Apple Music has 90 million paid subscribers as of 2022.
-
Amazon Music has over 65 million paid subscribers as of 2022.
-
YouTube Premium and Music has approximately 60 million paid subscribers as of 2022.
Video Streaming Statistics by Demographics
-
As of December 2025, 90% of U.S. households have access to a video streaming service.
This translates to around 120 million American households with access to video streaming services, showing a steady increase from previous years.
-
About 75% of millennials (ages 18-34) utilize video streaming services.
In contrast, only 55% of baby boomers (aged 65 and over) have access to at least one streaming service, highlighting the generational divide in streaming service consumption.
Streaming Statistics by Trends and Projections
-
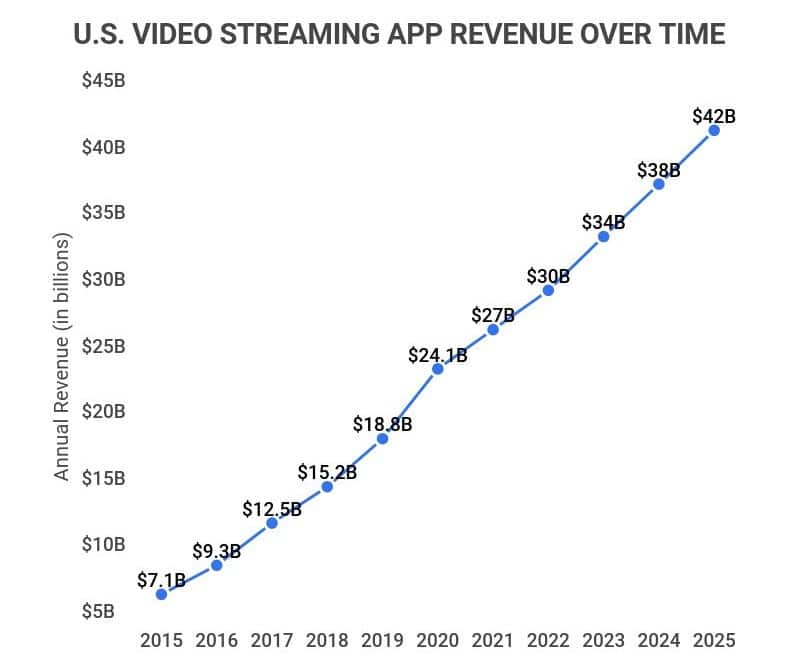
In 2015, video streaming app revenue in the United States was $7.1 billion.
-
From 2015 to 2022, revenue from video streaming apps increased by over 300%, from $7.1 billion to $30.8 billion.
-
The average American subscriber now has four video streaming services.
-
In 2015, 16% of American households reported using at least one streaming service daily. By 2022, this figure skyrocketed to 80% of American households engaging with video streaming services on a daily basis.
-
In 2015, music streaming revenue reached $2 billion, while it soared to $15 billion by 2022.

Streaming Statistics FAQ
-
What is the most used streaming service?
The most used paid streaming service is Netflix with 221 million subscribers worldwide and revenue of $30 billion in 2021. The most utilized free streaming service is YouTube, with 3 billion active users in 2025 and revenue of $8.6 billion in 2021.
However, recent shifts in the streaming market suggest that services like Amazon Prime Video are making significant strides to compete with Netflix.
-
What is the most profitable streaming service?
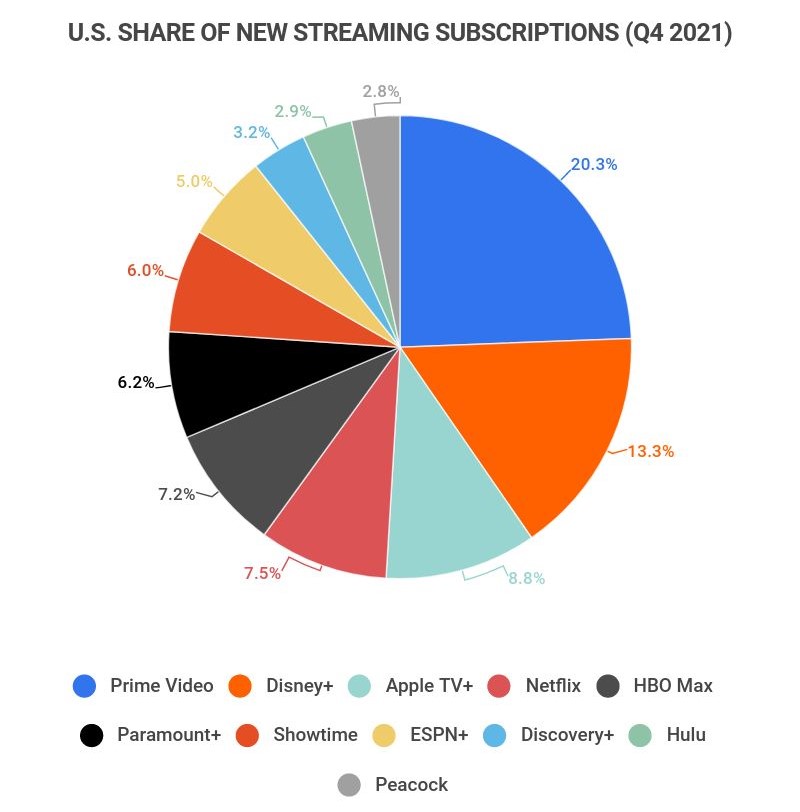
Netflix remains the most profitable streaming service, with annual revenue of $30 million. This is noteworthy, as Netflix comprises approximately 21% of the total streaming service market share, though Amazon Prime Video is close behind at 19%.
-
What is the fastest-growing streaming service?
The fastest-growing streaming service in 2022 is Paramount+, having added millions of new subscribers rapidly. In Q3 of 2022 alone, Paramount+ gained 4.6 million new subscribers, while Netflix added 2.4 million in the same period.
-
How much time do Americans spend watching streaming services each day?
Americans spend an average of 8 hours per day watching streaming services. This statistic suggests that the typical American dedicates one-third of their day to streaming content.
Conclusion
The love for streaming content continues to grow among Americans, with an expanding array of platforms providing diverse viewing options. The rise of services like Netflix, YouTube, Hulu, and HBO Max has revolutionized entertainment consumption in recent years. Additionally, music streaming platforms such as Spotify and Apple Music have seen similar success.
Just a few years ago, only 16% of American households reported using a streaming service daily. Fast forward to 2022, and that figure soared to 80%, highlighting the rapid change in consumer habits.
In the realm of music streaming, revenue reached a significant $2 billion in 2015, skyrocketing to $15 billion by 2022.
As of 2026, there are over 200 active video streaming services, and an impressive 523.9 million individuals subscribe to music streaming services globally. The future of the streaming industry appears bright, with continuous growth anticipated in the coming years.
References
-
Deloitte. Digital Media Trends 15th Edition – Press Release | Deloitte US. Accessed on March 24, 2022
-
eMarketer. Netflix throws itself further into original content – Insider Intelligence Trends, Forecasts & Statistics. Accessed on March 24, 2022
-
TV Technology. Streaming Industry to Cross $100B in Revenue by 2025 (Report) | TV Tech. Accessed on March 24, 2022
-
Statistica. • US YouTube reach by age group 2020 | Statista. Accessed on March 24, 2022
-
Statistica. Share of adults with a Netflix subscription in the United States as of March 2020. Accessed on March 24, 2022
-
Business of Apps. Video Streaming App Revenue and Usage Statistics (2022). Accessed on March 24, 2022
-
Fierce Video. Google says YouTube TV has over 3M paid subscribers | Fierce Video. Accessed on March 24, 2022
-
Gadget 360. Netflix Sees Disappointing Subscriber Growth in Q4 2021, Adds 8.3 Million Users Worldwide | Entertainment News. Accessed on March 24, 2022
-
Statistica. • Netflix subscribers count in the US 2021 | Statista. Accessed on March 24, 2022
-
Statistica. • Global music streaming revenue 2020 | Statista. Accessed on March 24, 2022
-
Statistica. Music Streaming – Statistics & Facts | Statista. Accessed on March 24, 2022
-
Hollywood Reporter. Spotify Hits 180M Paying Subscribers Amid Joe Rogan Protests. Accessed on March 24, 2022
-
9to5 Mac. Apple Music is the second most used music streaming service – but still far behind Spotify. Accessed on March 24, 2022
-
The Verge. YouTube reports having 50 million Premium and Music subscribers – The Verge. Accessed on March 24, 2022
-
9to5 Mac. Amazon Music subscriber numbers revealed vs Apple Music – 9to5Mac. Accessed on March 24, 2022
-
Kantar. 85% of US households have a video subscription service. Accessed on March 24, 2022
-
Statistica. • Subscriptions to streaming services in the US by age 2019 | Statista. Accessed on March 24, 2022
-
Fierce Video. Over three-quarters of US households subscribe to a streaming service | Fierce Video. Accessed on March 24, 2022
-
Statistica. • Netflix: quarterly revenue 2021 | Statistica. Accessed on March 24, 2022
-
Business Insider. The best streaming services you can sign up for in 2022. Accessed on March 24, 2022
-
Vindicia. How many streaming video services does the average person subscribe to? | Vindicia. Accessed on March 24, 2022
-
Indie Wire. The Average American Is Streaming 8 Hours of Content Daily — Report | IndieWire. Accessed on March 24, 2022
-
Flixed. The Complete List of Streaming Services in 2022 – 200+ Services | Flixed. Accessed on March 24, 2022
-
Tech Crunch. Spotify still tops other music services, but its market share declined | TechCrunch. Accessed on March 24, 2022
- Tech Industry Statistics
- MFA Statistics
- Streaming Services Statistics
- Mobile Vs. Desktop Usage Statistics
- AI Statistics
- Live Streaming Statistics
- Zoom Meeting Statistics
- Cord Cutting Statistics
- Digital Transformation Statistics
- Virtual Reality Statistics
- How Fast Is Technology Advancing
- Mobile Commerce Statistics
- SaaS Statistics
- Machine Learning Statistics
- Diversity In High Tech
- Cyber Security Statistics
- Ecommerce Statistics
- Tech Industry
- Gaming Industry
- Renewable Energy Job Creation
- Smartphone Industry
- Cybercrime Statistics
- Amazon Statistics
- Personalization Statistics
Author
Sky Ariella is a professional freelance writer, originally from New York. She has been featured on websites and online magazines covering topics in career, travel, and lifestyle. She received her BA in psychology from Hunter College.