Find a Job You Really Want In
Graphic Designers remain a vital profession in the United States, with job opportunities available across every state. As the demand for creative talent continues to grow, it’s essential to identify the best locations for graphic designers to thrive, considering factors like job availability and competitive compensation.
At Zippia, we analyzed data from the Bureau of Labor Statistics (BLS) to determine the optimal states for graphic designers in 2026. Our focus was on identifying regions where professionals can expect ample job opportunities and fair salaries throughout their careers.
After careful analysis, we present the top states for graphic designers in America:
This list highlights the best states for graphic designers, providing insight into where you can find the most rewarding opportunities in this creative field.
Curious about how we determined these rankings? Let’s explore our methodology and delve deeper into the specifics of each state.
If you want to learn more about the job landscape, check out:
- These Are The 10 Best Cities For Graphic Designers
- Best Companies to Work For in Chicago, IL
- These Are The 20 Best Small Companies In Chicago To Work For
How We Determined the Best States for Graphic Designers
At Zippia, we engage with a diverse range of job seekers to understand their priorities. Our research reveals two key factors that professionals seek:
- Job availability
- Competitive salary
To identify the best states for graphic designers, we evaluated job availability and salary data, focusing on the following criteria from the Bureau of Labor Statistics’ Occupational Employment Statistics:
- Location Quotient: A measure of how prevalent graphic design jobs are in each state.
- Average annual salary.
- Average annual salary for entry-level positions.
- Average annual salary for experienced professionals.
We standardized salary data relative to each state’s cost of living, ensuring a fair comparison. For example, while the average salary for graphic designers in California is $61,100, the same figure in Illinois, at $56,890, often stretches further due to lower living costs.
We ranked each state based on the above criteria, assigning scores from 1 to 50, with 1 being the best. The state with the lowest overall score emerged as the top state for graphic designers in the U.S.
1. Illinois

Total Jobs: 11,700
Average Annual Salary: $56,890
Average Entry Level Salary: $31,680
Average Experienced Salary: $88,260
Location Quotient: 1.3
2. Washington
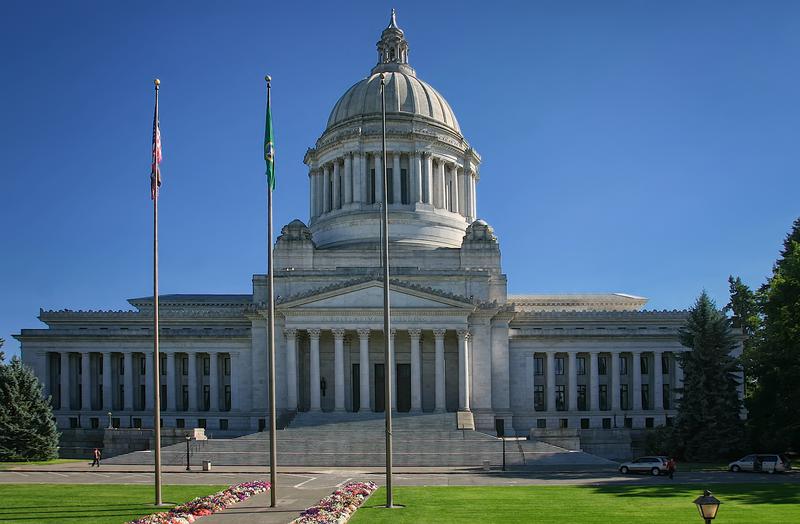
Total Jobs: 5,060
Average Annual Salary: $60,530
Average Entry Level Salary: $34,630
Average Experienced Salary: $90,400
Location Quotient: 1.03
3. Georgia
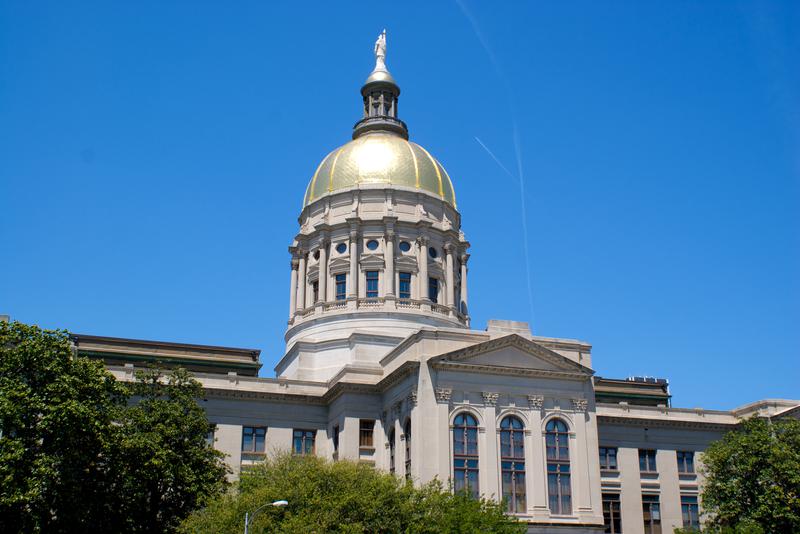
Total Jobs: 6,400
Average Annual Salary: $54,260
Average Entry Level Salary: $29,310
Average Experienced Salary: $84,370
Location Quotient: 0.97
4. Minnesota
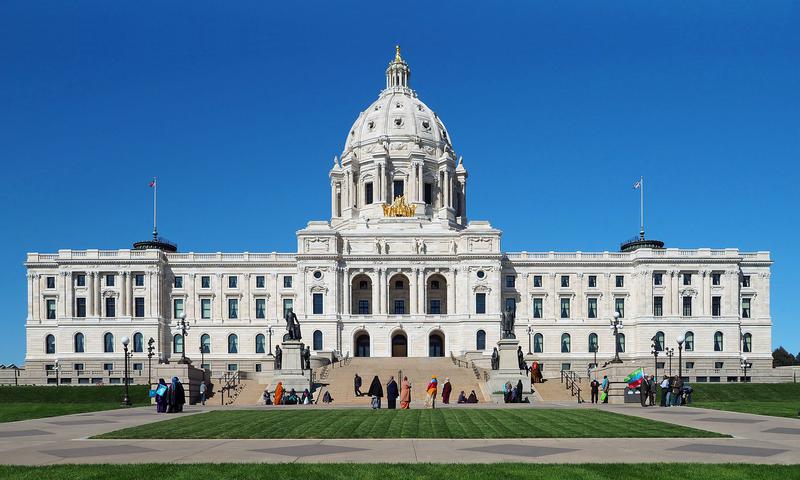
Total Jobs: 6,190
Average Annual Salary: $53,500
Average Entry Level Salary: $32,900
Average Experienced Salary: $80,200
Location Quotient: 1.44
5. Virginia
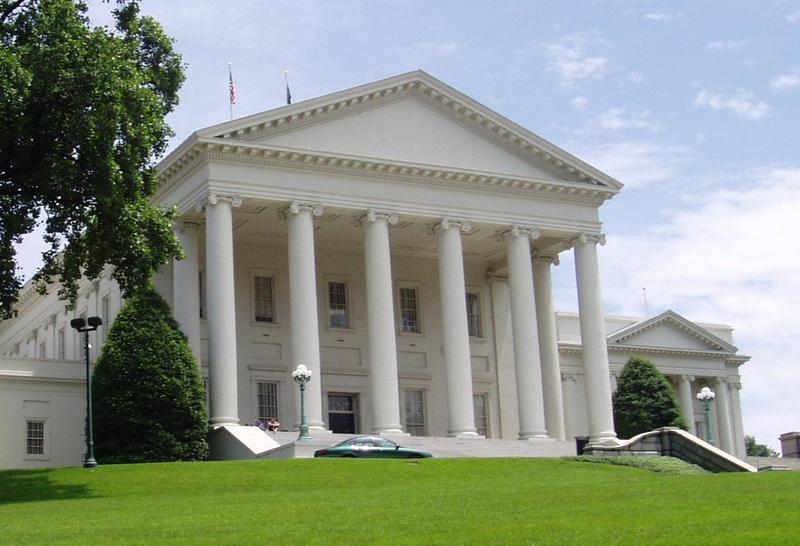
Total Jobs: 5,000
Average Annual Salary: $60,540
Average Entry Level Salary: $30,200
Average Experienced Salary: $98,140
Location Quotient: 0.87
6. Colorado
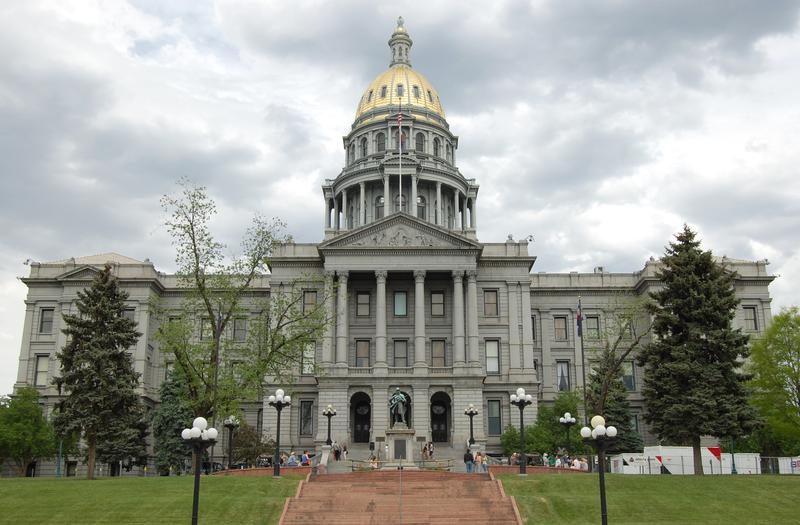
Total Jobs: 4,730
Average Annual Salary: $56,670
Average Entry Level Salary: $31,820
Average Experienced Salary: $81,020
Location Quotient: 1.2
7. Nebraska
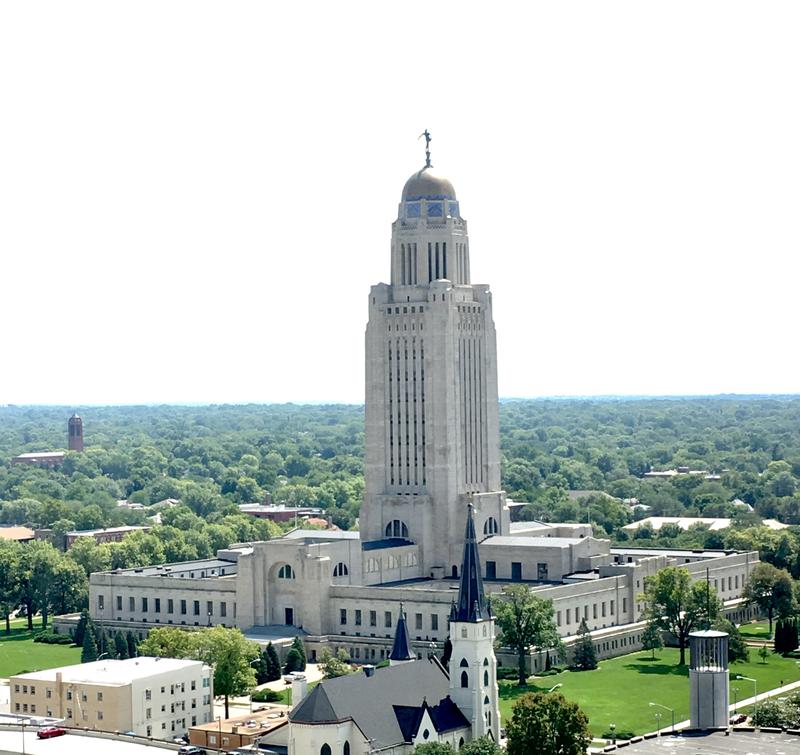
Total Jobs: 1,880
Average Annual Salary: $47,980
Average Entry Level Salary: $28,000
Average Experienced Salary: $72,660
Location Quotient: 1.27
8. Texas
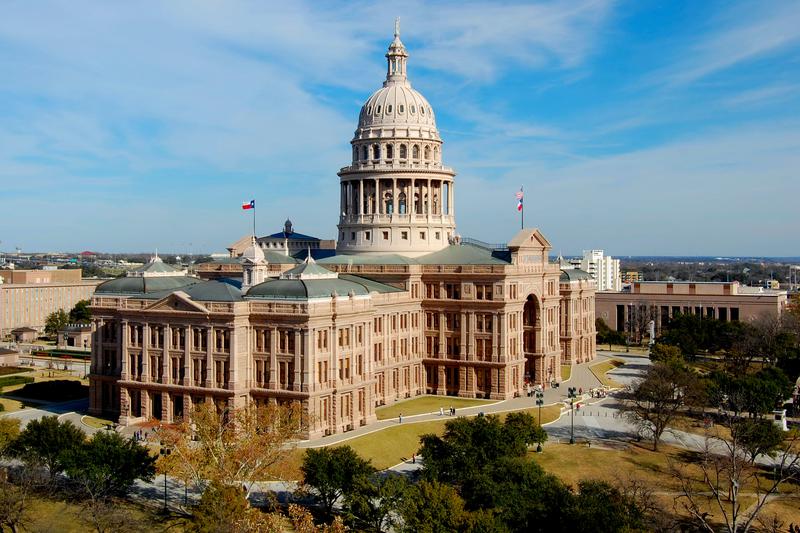
Total Jobs: 13,480
Average Annual Salary: $50,700
Average Entry Level Salary: $27,970
Average Experienced Salary: $79,510
Location Quotient: 0.74
9. Utah
Total Jobs: 3,370
Average Annual Salary: $48,130
Average Entry Level Salary: $27,150
Average Experienced Salary: $74,210
Location Quotient: 1.54
10. Missouri
Total Jobs: 3,740
Average Annual Salary: $50,350
Average Entry Level Salary: $26,470
Average Experienced Salary: $78,160
Location Quotient: 0.89
There You Have It – The Best States for Graphic Designers
If you’re starting your career as a graphic designer, these states should be at the top of your list. They offer competitive salaries, a wealth of job opportunities, and potential for career advancement.
For context, here are the states where graphic designers may face challenges:
For further reading, check out:
- These Are The 100 Highest Paying Jobs In Chicago
- These Are The 100 Highest Paying Jobs In Illinois
- These Are The 100 Largest Companies In Illinois
- These Are The 10 Highest Graphic Designer Salaries By State
Detailed List Of The Best States For Graphic Designers
| Rank | State | Average Salary |
|---|---|---|
| 1 | Illinois | $56,890 |
| 2 | Washington | $60,530 |
| 3 | Georgia | $54,260 |
| 4 | Minnesota | $53,500 |
| 5 | Virginia | $60,540 |
| 6 | Colorado | $56,670 |
| 7 | Nebraska | $47,980 |
| 8 | Texas | $50,700 |
| 9 | Utah | $48,130 |
| 10 | Missouri | $50,350 |
| 11 | Ohio | $50,130 |
| 12 | Michigan | $47,700 |
| 13 | Tennessee | $48,760 |
| 14 | Kansas | $46,270 |
| 15 | Arizona | $54,030 |
| 16 | Wisconsin | $47,980 |
| 17 | North Carolina | $49,700 |
| 18 | Pennsylvania | $53,050 |
| 19 | Rhode Island | $58,720 |
| 20 | New York | $64,840 |
| 21 | Delaware | $50,920 |
| 22 | Oregon | $56,690 |
| 23 | Florida | $48,780 |
| 24 | Alabama | $46,960 |
| 25 | Mississippi | $42,640 |
| 26 | Indiana | $45,030 |
| 27 | Idaho | $45,620 |
| 28 | Massachusetts | $64,010 |
| 29 | Arkansas | $42,250 |
| 30 | Iowa | $43,920 |
| 31 | Kentucky | $44,550 |
| 32 | West Virginia | $45,360 |
| 33 | New Jersey | $59,140 |
| 34 | Connecticut | $60,700 |
| 35 | Louisiana | $45,660 |
| 36 | Nevada | $49,330 |
| 37 | California | $61,100 |
| 38 | South Carolina | $45,790 |
| 39 | Vermont | $50,000 |
| 40 | New Hampshire | $51,710 |
| 41 | Maryland | $58,610 |
| 42 | Montana | $42,220 |
| 43 | South Dakota | $36,300 |
| 44 | North Dakota | $41,800 |
| 45 | New Mexico | $44,040 |
| 46 | Alaska | $59,640 |
| 47 | Wyoming | $38,490 |
| 48 | Oklahoma | $40,710 |
| 49 | Maine | $45,800 |
| 50 | Hawaii | $51,690 |
Author
Chris Kolmar is a co-founder of Zippia and the editor-in-chief of the Zippia career advice blog. He has hired over 50 people in his career, been hired five times, and wants to help you land your next job. His research has been featured on the New York Times, Thrillist, VOX, The Atlantic, and a host of local news. More recently, he's been quoted on USA Today, BusinessInsider, and CNBC.