- Business Statistics
- Startup Statistics
- Cloud Adoption Statistics
- Customer Loyalty Statistics
- Nonprofit Statistics
- Affiliate Marketing Statistics
- Cart Abandonment Rate Statistics
- Ridesharing Statistics
- Call Center Statistics
- eLearning statistics
- Customer Service Statistics
- Customer Experience statistics
- Entrepreneur Statistics
- Outsourcing Statistics
- Gross Revenue for Marketing and Advertising
- Sales Statistics
- MBA Statistics
- Average Small Business Revenue + Profit Margin
- How Much Do Employee Benefits Cost?
25+ Cart Abandonment Rate Statistics [2026]: Ecommerce Industry Insights You Need to Know
Research Summary. As online shopping continues to thrive in 2026, retailers face the ongoing challenge of cart abandonment. While attracting potential customers to their websites has become easier, converting those visits into sales remains a struggle. Below are key statistics regarding cart abandonment in the current ecommerce landscape:
-
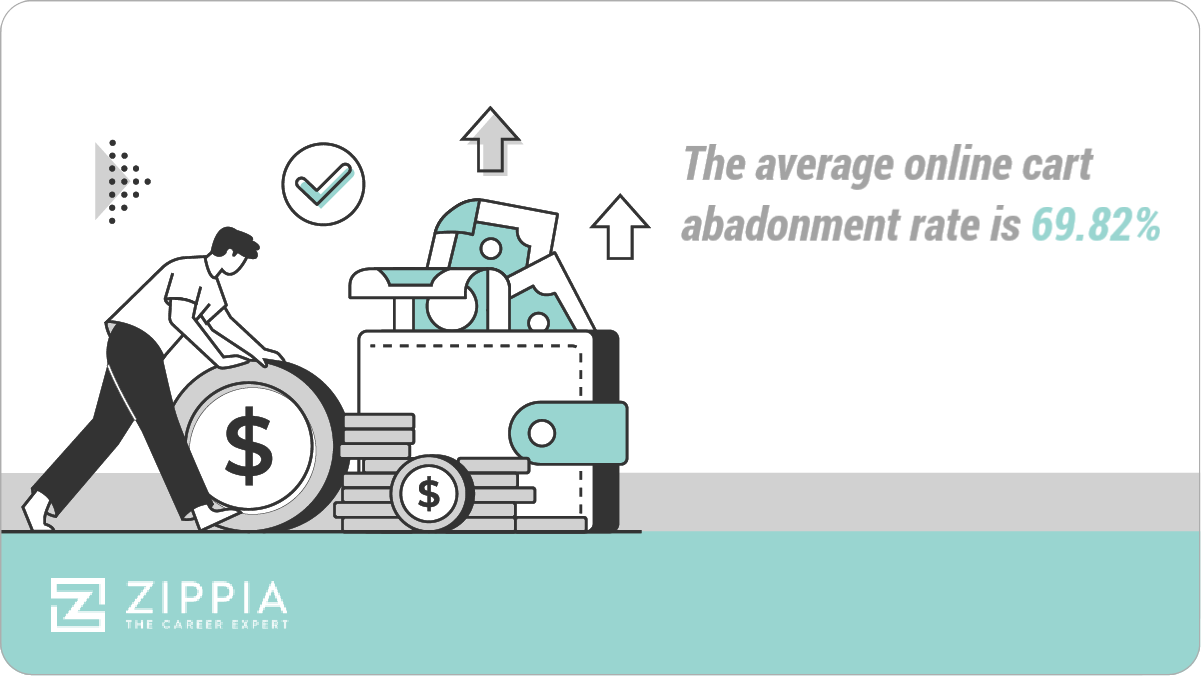
The average online shopping cart abandonment rate is 69.82%.
-
Over 80% of mobile shoppers abandon their carts.
-
Approximately 70% of shoppers abandon their carts upon encountering shipping costs.
-
$18 billion is lost to cart abandonment annually.
-
18% of online shoppers prefer not to purchase rather than navigate a complicated checkout process.
-
The conversion rate of abandoned cart emails is over 10%.
For further insights, we have categorized the data as follows:
Cart Abandonment Reasons | Ways to Prevent Cart Abandonment | Abandonment Rates by Device | Email Marketing
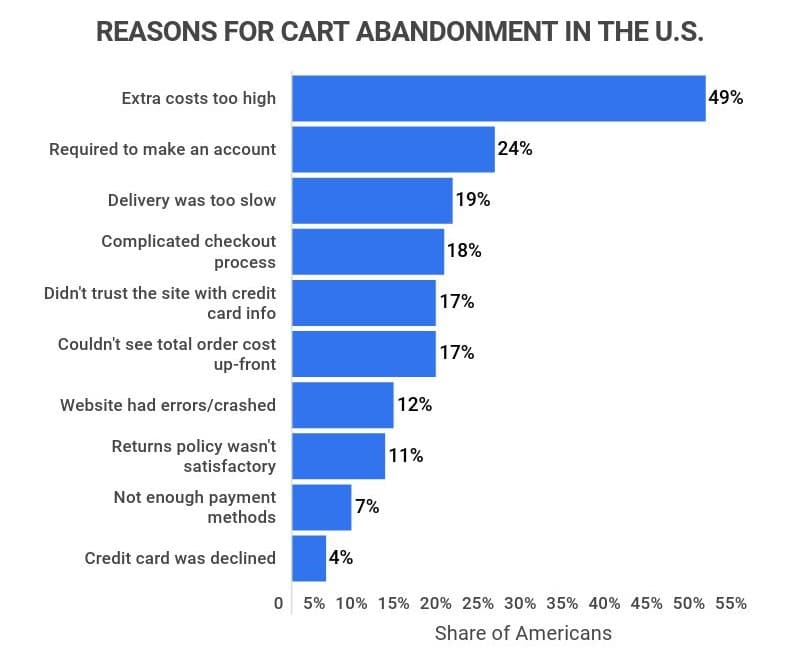
Cart Abandonment Rate Statistics by Top Reasons for Cart Abandonment
-
49% of shoppers abandon their carts due to high shipping or tax costs.
-
24% of shoppers abandon their cart because they are required to create an account.
-
19% of shoppers abandon their carts due to slow delivery times.
-
18% of shoppers abandon their carts because the checkout process is too lengthy or complicated.
-
17% of shoppers abandon their carts due to a lack of trust in the site for providing their credit card information.
-
17% of shoppers abandon their carts because they cannot see their order total upfront.
-
12% of shoppers abandon their carts due to website errors or crashes.
-
11% of shoppers abandon their carts because the return policy is unsatisfactory.
-
7% of shoppers abandon their carts due to a lack of payment options.
-
4% of shoppers abandon their carts because their credit card was declined.
Cart Abandonment Rate Statistics by Ways to Prevent Cart Abandonment
-
79% of consumers are more likely to shop online when offered free shipping.
Additionally, 54% of shoppers are more inclined to shop online when free returns or exchanges are guaranteed. This expectation has become particularly strong among customers under 25, with over half indicating that same-day shipping is the primary factor driving their online purchases, followed closely by next-day shipping and free returns.
-
Retargeted ads lead to 30% of non-converting shoppers returning to the website where they abandoned their carts.
These ads, including display and social media ads, target users who have previously engaged with the website but did not complete a purchase.
-
The automotive industry has the highest cart abandonment rate, while the grocery industry has the lowest.
Cart Abandonment Rates by Industry
Industry Cart Abandonment Rate Automotive 89.11% Airlines 88.87% Fashion 88.57% Luxury 87.79% Travel 85.22% Baby & Child 85.1% Cruise & Ferry 83.96% Hotel 82.71% Car Rental 80.83% Gardening & DIY 80.21% Mobile Providers 76.68% Department Store 76.63% Retail 76.34% Sports & Outdoor 75.67% Cosmetics 75.35% Pharmaceutical 71.51% Consumer Electronics 70.65% Groceries 61.13%

Cart Abandonment Rate Statistics by Device
-
The average cart abandonment rate remains at 69.82%.
This figure has been consistent over several years and indicates that a significant portion of online shopping carts are abandoned regularly.
-
Mobile shoppers abandon carts at a higher rate than desktop users.
Recent statistics indicate that the cart abandonment rate was 80.6% for mobile phones compared to 66.1% for desktops.
-
63% of online shoppers prefer mobile apps over mobile sites due to convenience.
Furthermore, 57% of these users claim that retail apps are faster than websites, while 40% appreciate the ability to store user settings, and 31% enjoy better rewards and benefits.
Cart Abandonment Rate Statistics by Email Marketing
-
The average open rate for abandoned cart emails is 45%.
This means that nearly half of recipients engage with these reminder emails. The average click-through rate stands at 21%, indicating that a significant portion of users return to the website after seeing these emails.
-
The conversion rate of abandoned cart emails exceeds 10%.
This suggests that over 10% of recipients ultimately complete their purchases after receiving these reminder messages.
-
Sending a series of abandoned cart emails is 63% more effective than sending a single email.
A strategic sequence may include a reminder shortly after abandonment, followed by additional offers such as discounts or free shipping to incentivize return visits.
Cart Abandonment Rate Statistics FAQ
-
How do you calculate cart abandonment rate?
To calculate the cart abandonment rate, divide the number of abandoned carts during a specific time period by the total number of carts created during that same period.
For instance, if your online retail site generated 568 carts over three months, but 254 were abandoned, your abandonment rate would be calculated as 254 divided by 568, resulting in a rate of 44.7%.
-
What is the average cart abandonment rate?
The average cart abandonment rate is 69.82%. However, this figure can vary significantly between companies, with some reporting rates as high as 89%. The automotive industry, for example, has the highest rate at 89.11%, while groceries have the lowest at 61.13%.
-
What is a good checkout abandonment rate?
A good checkout abandonment rate is below the average of 69.82%. However, benchmarks can vary widely by industry, so it’s essential to compare your rate against industry standards.
-
What is a cart conversion rate?
A cart conversion rate is the percentage of carts that ultimately convert into sales. This includes both immediate purchasers and those who return after initially abandoning their carts.
Conclusion
As online shopping continues to dominate retail in 2026, cart abandonment remains a significant concern for ecommerce businesses. With an average abandonment rate of 69.82%, this translates to an estimated loss of $18 billion in revenue annually. Mobile devices exhibit the highest cart abandonment rates, with 80% of mobile shoppers leaving their carts behind. Industries such as automotive, airlines, and fashion face the steepest challenges, while grocery and consumer electronics experience lower abandonment rates.
Customers abandon their carts for various reasons, primarily due to unexpected shipping or tax costs. Other common factors include the necessity to create an account, slow delivery, and overly complicated checkout processes.
References
-
Dynamic Yield. “The Art and Science of Killer Abandoned Cart Emails.” Accessed on March 3, 2022.
-
Statista. “Main Reasons Why Consumers in the United States Abandoned Their Orders During the Checkout Process in 2021.” Accessed on March 3, 2022.
-
Walker Sands Communications. “The Future of Retail 2018.” Accessed on March 3, 2022.
-
Unific. “Abandoned Cart: The Ultimate Guide.” Accessed on March 3, 2022.
-
Statista. “Online Shopping Cart Abandonment Rate in Selected Industries in March 2021.” Accessed on March 3, 2022.
-
Baymard Institute. “46 Cart Abandonment Rate Statistics.” Accessed on March 3, 2022.
-
Statista. “Online Shopping Cart Abandonment Rate in the United States From 2nd Quarter 2020 to 2nd Quarter 2021, by Device.” Accessed on March 3, 2022.
-
Clearbridge Mobile. “The Top Mobile Shopping Issues Your Customers Are Facing.” Accessed on March 3, 2022.
-
Moosend. “[Infographic] Cart Abandonment Rate & Reasons.” Accessed on March 3, 2022.
-
HubSpot. “The 11 Best Abandoned Cart Emails To Win Back Customers.” Accessed on March 3, 2022.
- Business Statistics
- Startup Statistics
- Cloud Adoption Statistics
- Customer Loyalty Statistics
- Nonprofit Statistics
- Affiliate Marketing Statistics
- Cart Abandonment Rate Statistics
- Ridesharing Statistics
- Call Center Statistics
- eLearning statistics
- Customer Service Statistics
- Customer Experience statistics
- Entrepreneur Statistics
- Outsourcing Statistics
- Gross Revenue for Marketing and Advertising
- Sales Statistics
- MBA Statistics
- Average Small Business Revenue + Profit Margin
- How Much Do Employee Benefits Cost?
Author
Abby is a writer who is passionate about the power of story. Whether it’s communicating complicated topics in a clear way or helping readers connect with another person or place from the comfort of their couch. Abby attended Oral Roberts University in Tulsa, Oklahoma, where she earned a degree in writing with concentrations in journalism and business.