20+ National Football League Demographic And Financial Statistics [2026]: NFL Revenue + History
NFL Research Summary. The National Football League (NFL) has seen a significant evolution in its demographic and financial landscape. While the player base is predominantly composed of individuals from diverse racial backgrounds, management and coaching roles remain largely occupied by white males. However, ongoing efforts to enhance inclusivity and diversity are gradually reshaping the league’s structure and representation.
Our data analysis team has compiled the following key insights:
-
The NFL’s total revenue for the 2025 season reached $20 billion, marking a substantial increase from $18 billion in 2022.
-
The average franchise value of an NFL team is now $5.1 billion.
-
According to TIDES data, the NFL received a racial hiring grade of B+ and a gender hiring grade of C+.
-
As of 2026, 56.2% of National Football League players are people of color.
-
Approximately 15 million people watch a regular-season NFL game on TV, compared to 4.5 million for the NBA, 2.3 million for MLB, 1.5 million for NHL, and 1.2 million for MLS.
For further analysis, we have categorized the data into the following sections:
Gender | General Financial | Fan
National Football League Statistics by Race
The NFL has consistently faced scrutiny regarding race relations within the sport. To better understand the link between the NFL’s hiring practices and race, consider these essential facts:
-
As of 2026, 56.2% of NFL players are people of color, a decrease from 69.4% in 2020.
The breakdown includes 54.2% Black or African-American players, 24.8% White, 0.5% Hispanic or Latinx, 0.2% Asian, 2.0% Pacific Islander, and 0.3% American Indian. About 9.0% of players identify as multiracial.
This shift reflects the NFL’s TIDES racial score of 85.0% in 2022. Below is a summary of the NFL’s report card scores across various racial categories:
TIDES NFL Racial Report Card Scores
Category Grade Overall Racial Hiring B+ Race of NFL Players A+ Head Coaches D+ Assistant Coaches A+ GMs/Principal-in-Charge F CEOs/Presidents D+ Senior Administration B Professional Administration B+ NFL Players A+ League Office A+ C-Suite Executives C- Vice Presidents C- -
Representation of Black or African-American head coaches is at 9.4% as of 2026.
Here’s a table detailing the racial breakdown of head coaching positions across the NFL:
People of Color Representation Among NFL Head Coaches
Year White Hispanic or Latinx Black or African American 2026 29 1 3 2025 28 1 3 2024 27 1 4 2023 28 1 3 2022 29 1 2 2021 27 1 4 2020 28 1 3 -
Representation of people of color among League Office executives is at 15.0%.
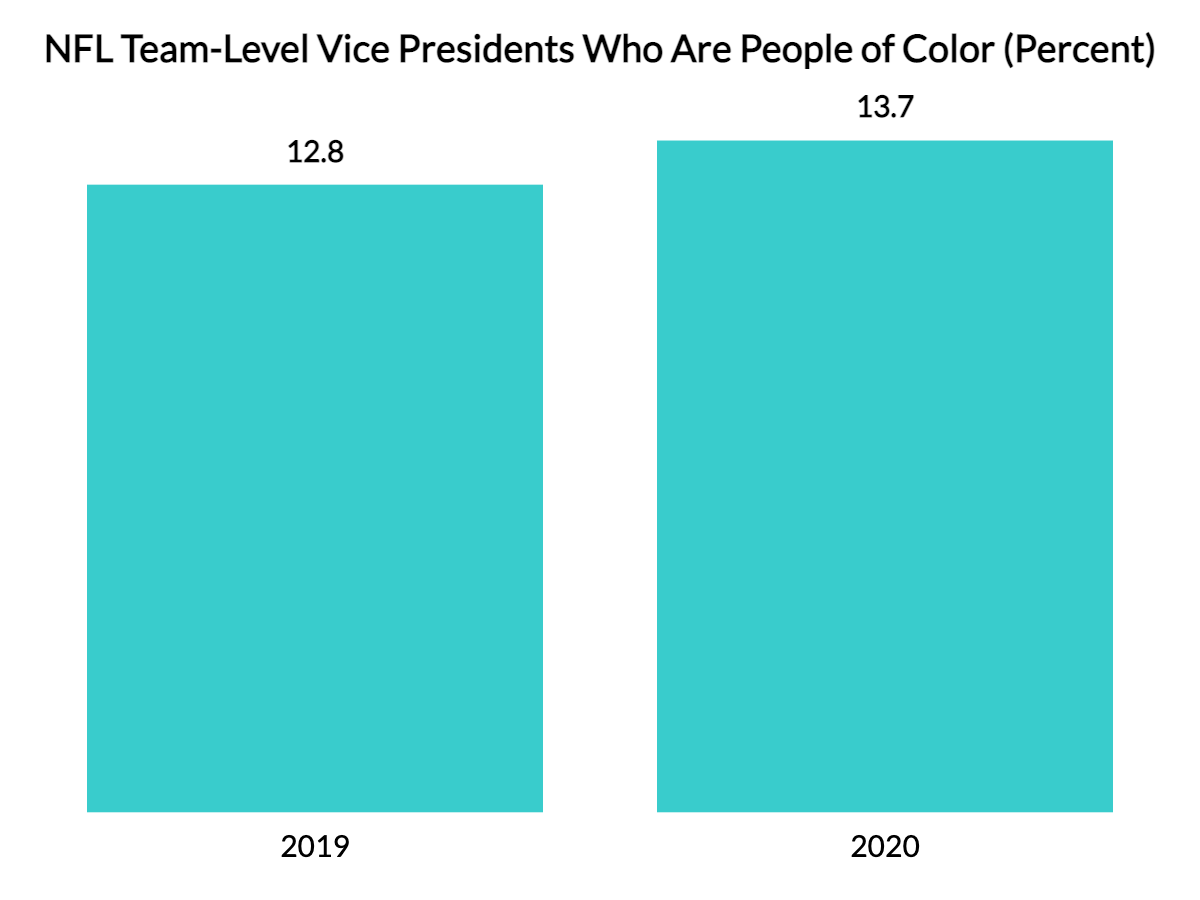
Currently, 14.5% of team-level vice presidents are people of color, up from 13.7% last year. In management roles, 32% are people of color, marking a significant increase.
-
Among the 260 broadcasters working with NFL TV and radio partners, only 50 were Black.
The representation of Black announcers in 2026 remains low, with only three notable announcers being Greg Gumbel with CBS, Brian Custer with FOX, and ESPN’s new hire.
-
In 2022, Jason Wright became the first Black team President in NFL history at the Washington Football Team.
Additionally, Shad Khan of the Jacksonville Jaguars and Kim Peluga of the Buffalo Bills continue to be the only individuals of color with significant ownership stakes in the league.
-
The NFL’s 2022 TIDES score for race is 85.0%, reflecting modest progress from 82.3% in 2019.
Factors contributing to this change include:
-
An increase in assistant coaches of color from 39% in 2021 to 41% in 2022;
-
Growth in management positions held by people of color within the League Office;
-
Improvements in professional administration roles, rising from 24.1% in 2020 to 27% in 2022.
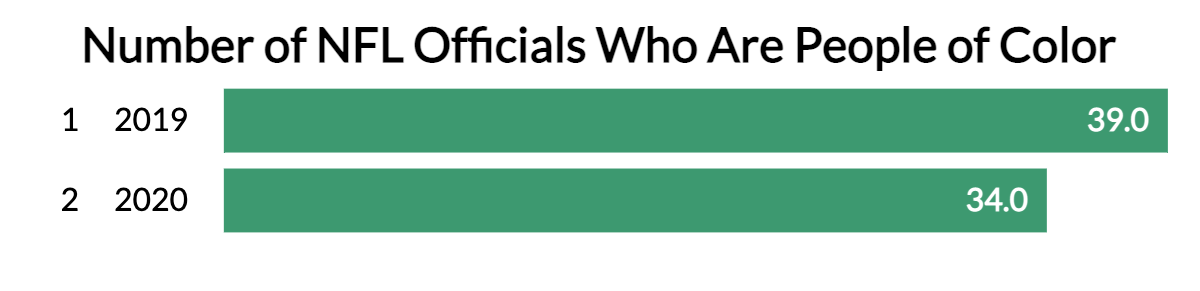
However, the NFL’s score decreased in terms of senior administration representation, and the number of POC officials decreased from a record high of 39 in 2019 to 34 in 2022.
-
National Football League Statistics by Gender
The NFL has historically been a male-dominated arena; however, the presence of women in various roles has grown significantly over the years. As of 2026, there are more female coaches and trainers than ever, although there is still a long way to go for gender parity.
-
The NFL’s 2022 TIDES score for gender is 82.5%, reflecting a 1.1% increase from the previous year. Notable women in the NFL include Jennifer King, Callie Brownson, and Sarah Thomas.
Despite progress, both senior administration and team professional administration levels have seen declines in gender TIDES scores. Here’s how various positions rank:
TIDES 2022 NFL Gender Report Card Scores
Category Grade Overall Gender Hiring C League Office B CEOs/Presidents F Senior Administration F Professional Administration C+ C-Suite Executives D+ Vice Presidents F -
In 2022, women comprised 42.0% of the NFL League Office, up from 38.2% in 2020.
As of 2022, there were 324 women holding positions within the League Office.
-
Women account for 26.5% of team administration positions in the NFL.
As of 2022, women held 26.5% of senior administration roles, up from 25.3% in 2021. Additionally, 32% of vice president and above positions are held by women, while women constitute 22.4% of vice president roles at the team level.
National Football League General Financial Statistics
The NFL operates as a multi-billion dollar enterprise, generating revenue through ticket sales, advertising, and merchandise. Here are some key financial insights into the NFL’s lucrative operations:
-
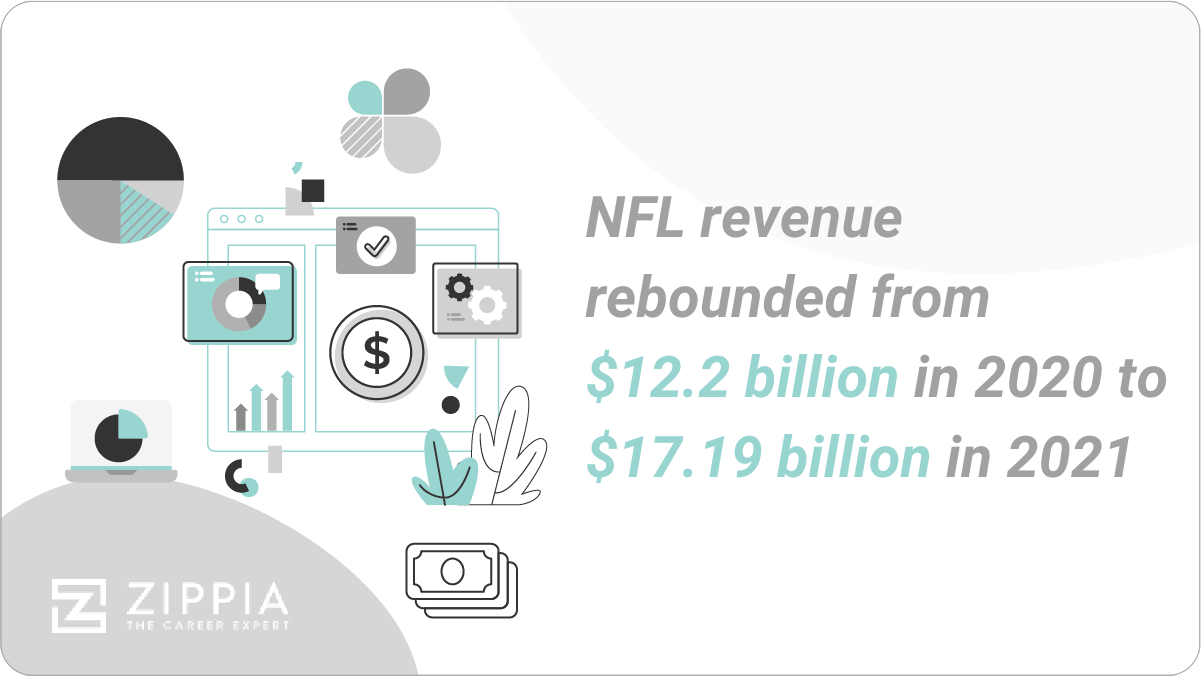
In 2022, the NFL generated more than $20 billion in total revenue, a significant increase from $12.2 billion in 2020.
Despite the pandemic’s impact, the NFL remains the most profitable professional sports league in the United States. Here’s how the revenue has evolved over the past two decades:
Total Revenue of All National Football League Teams
Year Revenue (Billions) 2025 $20.0B 2024 $18.5B 2023 $17.5B 2022 $18.0B 2021 $17.19B 2020 $12.2B 2019 $15.26B 2018 $14.48B 2017 $13.68B 2016 $13.16B 2015 $12.16B 2014 $11.09B 2013 $9.58B 2012 $9.17B 2011 $8.82B 2010 $8.35B 2009 $8.02B 2008 $7.57B 2007 $7.09B 2006 $6.54B 2005 $6.16B 2004 $6.03B 2003 $5.33B 2002 $4.94B 2001 $4.28B For comparison, Major League Baseball (MLB) had a revenue of about $10.37 billion, the National Basketball Association (NBA) about $7.92 billion, and the National Hockey League (NHL) about $4.37 billion in 2019.
-
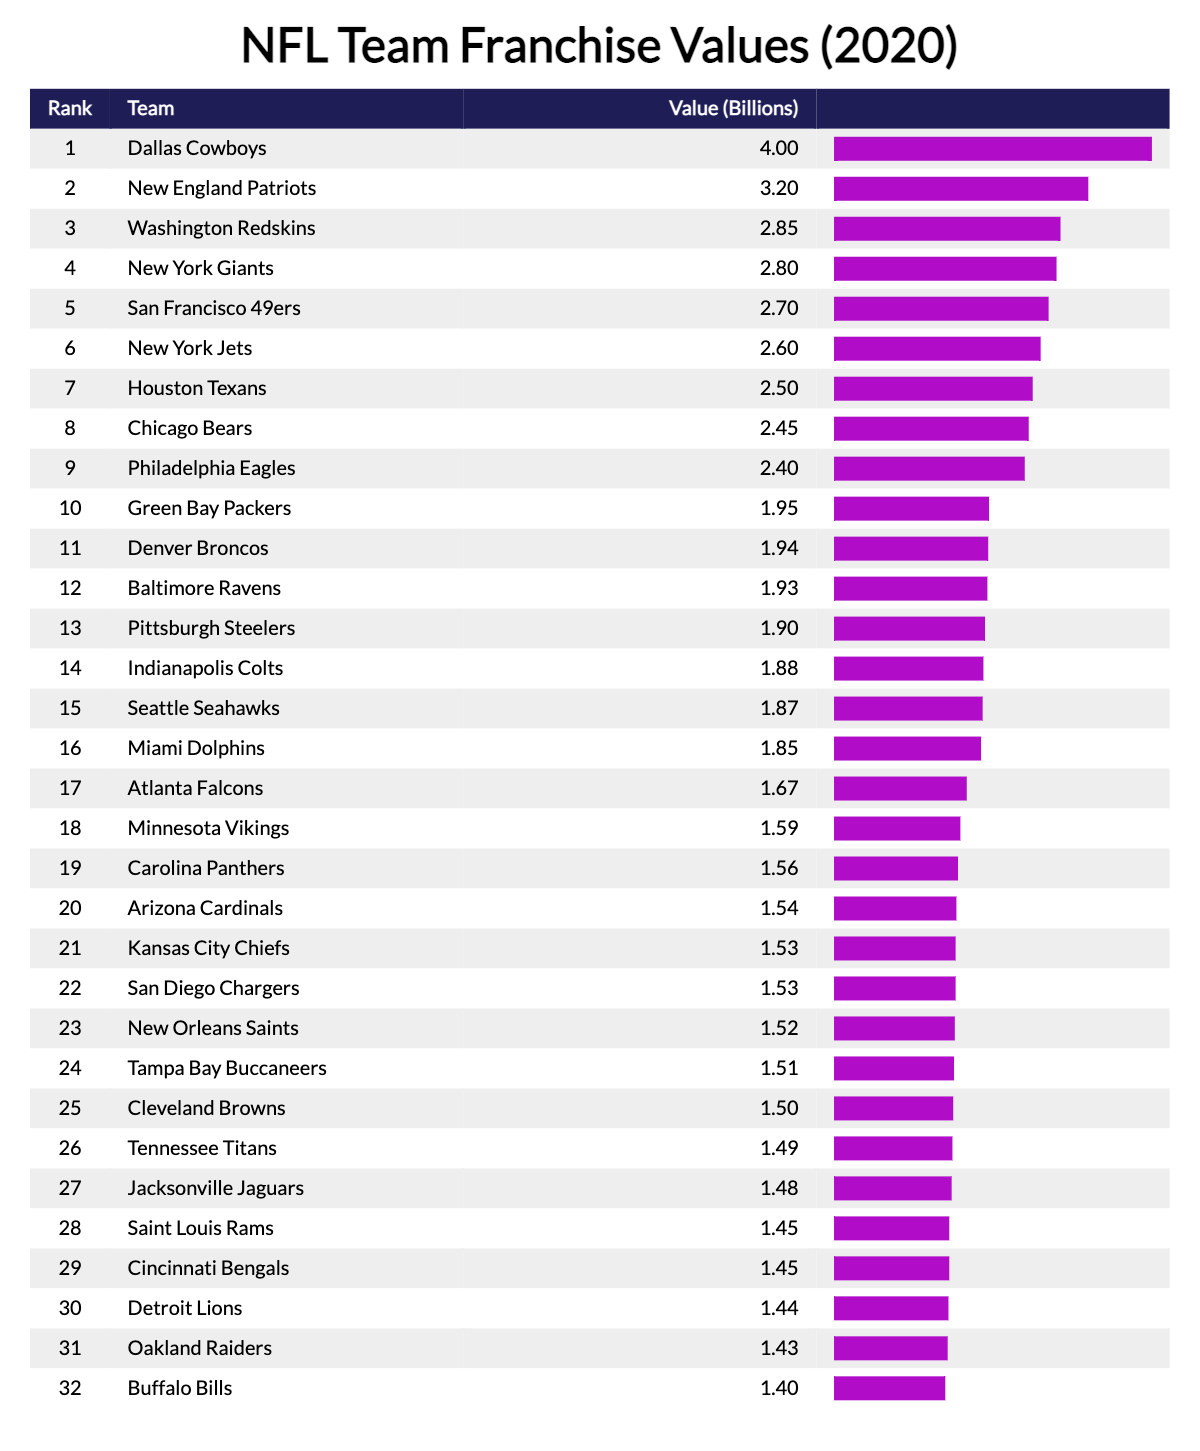
The average franchise value of an NFL team now stands at $5.1 billion.
The Dallas Cowboys, generating $800 million in revenue in 2022, remain the highest-grossing team with an estimated value of $6 billion. The New England Patriots follow closely with a franchise value of $5.5 billion.
In contrast, the Buffalo Bills are valued at around $2.4 billion, and the Los Angeles Chargers have faced financial challenges, with an estimated operating income of -$50 million.
Revenue-wise, the New England Patriots ranked second at $500 million, with the Los Angeles Rams at third with $450 million.
-
The NFL boasts a variety of revenue streams.
Typical revenue sources include:
-
Sponsorships (projected to reach $2 billion in 2022);
-
Media (including both broadcast and digital);
-
Partnerships;
-
Ticket and concession sales (accounting for 1.5% of total revenue in 2022);
-
Television rights.
On average, an NFL team earned approximately $9 million in ticket sales per stadium event in 2022, with an estimated profit margin of 8%. Key expenses include:
-
Athletes/musicians: 55%
-
Stadium administration: 10%
-
Coaching staff: 5%
-
Taxes: 5%
-
National Football League Fan Statistics
The NFL’s enduring success is largely attributed to its passionate fan base, which consistently supports teams through attendance and merchandise purchases. Here are some noteworthy facts about NFL fans:
-
Among professional sports leagues, the NFL continues to have the highest per-game attendance.
On average, an NFL game attracts over 66,000 spectators, with more than 16 million attendees during the 2022 season. Approximately 15 million viewers watched a regular-season NFL game on television.
-
The Super Bowl remains one of the largest single-day sports events globally.
The 2022 Super Bowl attracted 112.3 million TV viewers (120 million across all platforms), marking a significant rebound from previous years.
Super Bowl TV Viewership Over Time
Year Number of TV Viewers (Millions) 2026 115M 2025 112.3M 2024 110.4M 2023 108.2M 2022 112.3M 2021 96.4M 2020 100.45M 2019 98.19M 2018 103.39M 2017 111.32M 2016 111.86M 2015 114.44M 2014 112.19M 2013 108.69M 2012 111.35M 2011 111.01M 2010 106.48M 2009 98.73M 2008 97.45M 2007 93.18M Estimates suggest that the Super Bowl generates between $30 million and $500 million for host cities, alongside significant ad revenue for the league and substantial consumer spending leading up to the event.
National Football League Demographics and Financials FAQ
-
What percentage of NFL team revenue goes to player salaries?
About 48% of an NFL team’s revenue goes to player salaries in 2022. This represents a slight decrease from 55% in 2020, but still indicates a substantial income for players.
For instance, if season revenue sharing was $433.755 million in 2022, that equates to approximately $208.2 million for players.
-
How much do NFL players earn per season?
The average NFL player earns $860,000 per season. While the average annual salary exceeds $2 million, this figure is skewed by top-earning players. Rookies earn a minimum of $435,000, with each team operating under a salary cap of $188.2 million.
-
What’s the percentage of players of color in the NFL?
56.2% of NFL players are people of color in 2026. This is a decrease from 69.4% in 2020, with 54.2% identifying as Black, 0.5% Hispanic or Latinx, and 0.2% Asian.
-
What is the NFL’s annual revenue?
The NFL’s total revenue for 2025 was $20 billion. This reflects an increase from $18 billion in 2022.
-
How much is an NFL team worth?
The average 2025 value of an NFL team is $5.1 billion. This is an increase from just over $3 billion in 2020.
Conclusion
The NFL is making strides in promoting racial and gender diversity across various roles, both on and off the field, according to TIDES data. Despite experiencing revenue fluctuations recently, the league has demonstrated resilience and growth post-pandemic. As we look ahead, the NFL’s trajectory appears promising, with continued efforts to enhance diversity and inclusivity shaping its future.
Sources
-
The Institute for Diversity and Ethics in Sport. The 2020 Racial and Gender Report Card – National Football League. Accessed on 9/28/21.
-
Statista. Total revenue of all National Football League teams from 2001 to 2020. Accessed on 9/29/21.
-
Statista. National Football League (NFL) – Statistics Facts. Accessed on 9/29/21.
-
Statista. National Football League revenue by team in 2020. Accessed on 9/29/21.
-
Statista. Operating income of National Football League teams in 2020. Accessed on 9/29/21.
-
Investopedia. How The NFL Makes Money. Accessed on 9/29/21.
-
Sporting News. How many people watched Super Bowl 55? Ratings, viewership numbers take big hit in 2021. Accessed on 9/29/21.
-
Sports Media Watch. Super Bowl Ratings History (1967-present). Accessed on 9/29/21.
-
Business Insider. Why hosting the Super Bowl isn’t worth it, according to an economist. Accessed on 9/29/21.
-
CNBC. The Super Bowl is worth billions each year — Here’s who makes what. Accessed on 9/29/21.
-
Statista. Average television viewership of the NFL regular season from 2010 to 2020. Accessed on 9/29/21.
-
The Guardian. The NFL is 70% black, so why is its TV coverage so white? Accessed on 9/30/21.
-
Chron.com. How Much Money Does an NFL Player Make a Year? Accessed on 9/30/21.
Author
Chris Kolmar is a co-founder of Zippia and the editor-in-chief of the Zippia career advice blog. He has hired over 50 people in his career, been hired five times, and wants to help you land your next job. His research has been featured on the New York Times, Thrillist, VOX, The Atlantic, and a host of local news. More recently, he's been quoted on USA Today, BusinessInsider, and CNBC.