Find a Job You Really Want In
While many millennials face financial hurdles, including rising education costs, stagnant wages, and the increasing expense of everyday items, a significant number are still thriving financially. As of 2026, millennials—those aged 25 to 41—are earning more than previous generations at the same age, although disparities remain. The latest data highlights the states where the wealthiest millennials reside, showcasing vibrant economies and lucrative job opportunities.
Not all millennials are struggling financially; many enjoy substantial incomes and the comforts that come with them. To uncover where the richest millennials call home, we analyzed various factors and compiled a list of the top states for high-earning millennials.
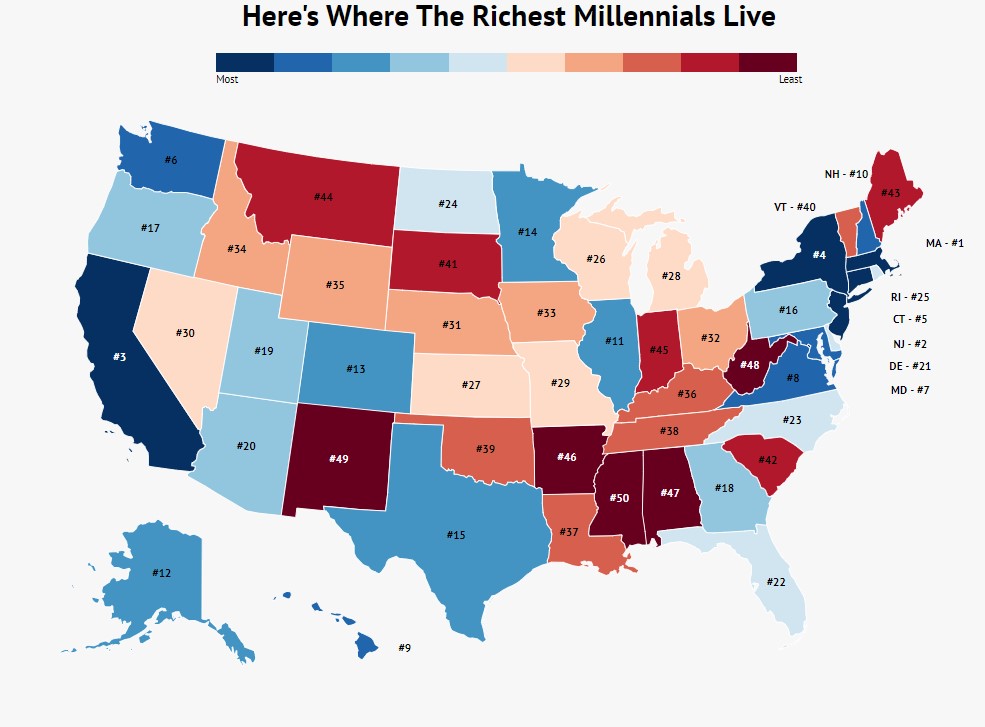
The States With The Richest Millennials
- Massachusetts
- New Jersey
- California
- New York
- Connecticut
- Washington
- Maryland
- Virginia
- Hawaii
- New Hampshire
The coastal states remain prime locations for high-earning millennials. Continue reading to discover how many millennials are reaping substantial rewards in these states—or skip to the bottom to find out where your state ranks.
How We Determined Where The Richest Millennials Live
Our analysis utilized the latest American Community Survey (ACS) data on income by householder type. We focused on individuals aged 25-44, capturing a mix of millennials and younger Gen-Xers.
We assessed the percentage of households earning over $200,000, identifying states with the highest proportions of wealthy millennials. While living costs vary, an income of $200,000 is significant across the nation. Nationally, only 6.9% of households achieve this income level, highlighting the exclusivity of these high earners.
1. Massachusetts

Percent: 14%
Total Millennial Homeowners: 816,603
Those earning over $200,000: 112,750
Massachusetts leads with 14% of millennial households earning over $200,000. While the winters can be harsh, those in this affluent state are well-equipped to handle the costs of living.
2. New Jersey

Percent: 13%
Total Millennial Homeowners: 969,537
Those earning over $200,000: 127,867
New Jersey ranks second, with 13% of millennial homeowners earning $200,000 or more—six times the percentage in Mississippi, showcasing its robust economic landscape.
3. California
Percent: 12%
Total Millennial Homeowners: 4,444,303
Those earning over $200,000: 554,873
It’s no surprise that California ranks high, housing tech hubs like Silicon Valley and Los Angeles, which attract top talent and offer competitive salaries.
4. New York

Percent: 12%
Total Millennial Homeowners: 2,317,001
Those earning over $200,000: 272,239
New York remains a vibrant hub for wealth, with 12% of millennial homeowners earning substantial incomes, despite recent population shifts.
5. Connecticut

Percent: 11%
Total Millennial Homeowners: 402,424
Those earning over $200,000: 43,084
Connecticut rounds out the top five, with 11% of millennial households earning over $200,000, reflecting its affluent reputation.
6. Washington

Percent: 11%
Total Millennial Homeowners: 1,015,815
Those earning over $200,000: 107,346
Washington boasts 11% of millennial homeowners earning $200,000 or more, driven by a strong tech industry presence, including giants like Amazon and Microsoft.
7. Maryland

Percent: 10%
Total Millennial Homeowners: 700,165
Those earning over $200,000: 72,232
Maryland ranks seventh, with high-paying jobs in healthcare and technology contributing to its wealthy millennial population.
8. Virginia

Percent: 9%
Total Millennial Homeowners: 1,036,915
Those earning over $200,000: 95,971
Virginia’s economy, bolstered by government and defense contractors, supports a substantial percentage of high-earning millennials.
9. Hawaii

Percent: 8%
Total Millennial Homeowners: 135,346
Those earning over $200,000: 11,384
Hawaii, while expensive, has 8% of its millennial homeowners earning well, thanks to its unique economic landscape.
10. New Hampshire

Percent: 8%
Total Millennial Homeowners: 146,356
Those earning over $200,000: 11,967
New Hampshire closes the list, with 8% of millennials earning substantial incomes, reflecting its overall affluence.
Insights on Wealth Among Millennials
From Massachusetts to New Hampshire, these states boast a higher percentage of millennials earning top salaries compared to the national average. Financial stability can lead to greater opportunities and quality of life. Wealth allows millennials to invest in their future, contribute to local economies, and build businesses.
The breakdown of income levels across all 50 states is available below:
The States With The Richest Millennials
| Name | Percent |
|---|---|
| Massachusetts | 13.8% |
| New Jersey | 13.2% |
| California | 12.5% |
| New York | 11.7% |
| Connecticut | 10.7% |
| Washington | 10.6% |
| Maryland | 10.3% |
| Virginia | 9.3% |
| Hawaii | 8.4% |
| New Hampshire | 8.2% |
| Illinois | 7.8% |
| Alaska | 7.7% |
| Colorado | 7.7% |
| Minnesota | 7.2% |
| Texas | 6.4% |
| Pennsylvania | 6.1% |
| Oregon | 6.0% |
| Georgia | 5.7% |
| Utah | 5.7% |
| Arizona | 5.3% |
| Delaware | 5.2% |
| Florida | 5.0% |
| North Carolina | 4.9% |
| North Dakota | 4.7% |
| Rhode Island | 4.5% |
| Wisconsin | 4.4% |
| Kansas | 4.4% |
| Michigan | 4.3% |
| Missouri | 4.3% |
| Nevada | 4.1% |
| Nebraska | 4.1% |
| Ohio | 4.0% |
| Iowa | 4.0% |
| Idaho | 3.9% |
| Wyoming | 3.9% |
| Kentucky | 3.7% |
| Louisiana | 3.6% |
| Tennessee | 3.6% |
| Oklahoma | 3.6% |
| Vermont | 3.5% |
| South Dakota | 3.5% |
| South Carolina | 3.4% |
| Mine | 3.4% |
| Montana | 3.3% |
| Indiana | 3.0% |
| Arkansas | 3.0% |
| Alabama | 2.8% |
| West Virginia | 2.8% |
| New Mexico | 2.6% |
| Mississippi | 2.2% |
Author
Kathy is the head of content at Zippia with a knack for engaging audiences. Prior to joining Zippia, Kathy worked at Gateway Blend growing audiences across diverse brands. She graduated from Troy University with a degree in Social Science Education.