The 10 Smelliest States (And The Freshest)
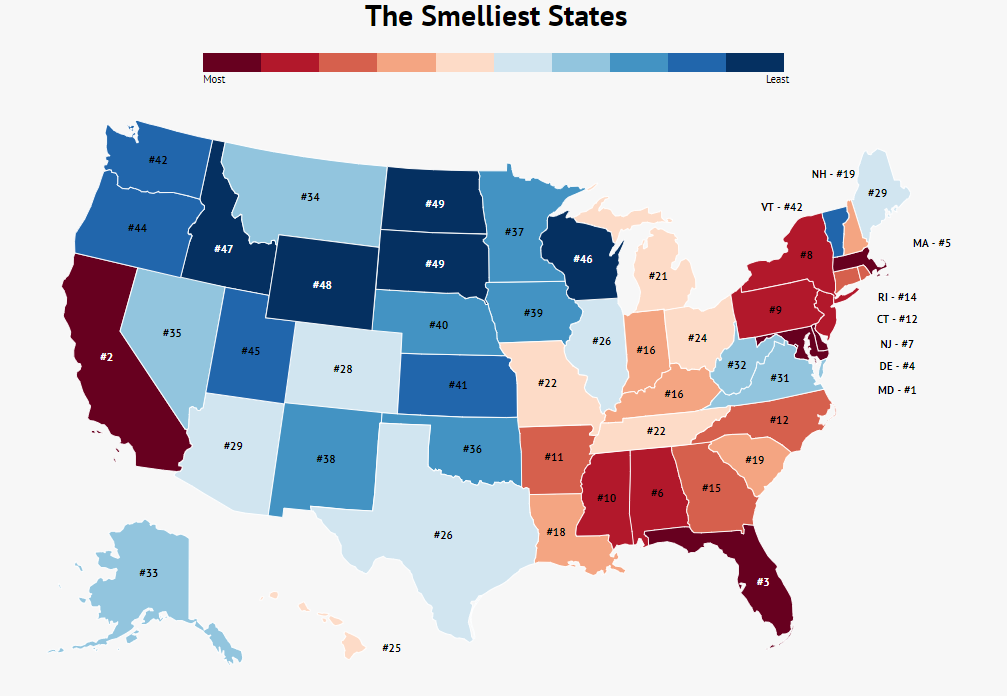
The smelliest state in the U.S. is Maryland, where 0.026% of land is dedicated to landfills and there are 610 people per square mile.
Among the top 10 smelliest states, New Jersey has the highest population density at 1,210.10 people per square mile.
Delaware ranks highest for landfill space at 0.0399%.
Alaska has the lowest landfill percentage, with just 0.0001%.
What’s that smell?
Anyone who’s taken a road trip across the U.S. can often pinpoint that answer as “Maryland,” prompting a quick roll-up of the car windows.
From landfills to less-than-ideal personal hygiene, some states can have a noticeable odor. However, not all states share the same level of “fragrance.”
So, which states rank as the smelliest in the U.S.? We embarked on a mission to quantify smell and identified the states that could use a little extra deodorant. Read on to discover the contenders for the title of smelliest states in America.
How We Determined This
To assess the odor levels in each state, we used a variety of concrete metrics.
-
Air quality
-
Landfill area, represented as the percentage of land occupied by landfills
We analyzed air quality data sourced from Air Filters Delivered to gauge which states had the dirtiest air. Generally, cleaner air correlates with a fresher smell.
For landfill statistics, we relied on the EPA’s data regarding the land dedicated to waste disposal across each state.
Next, we examined human-related odor factors, as smell is often affected by people:
-
Population density
-
Oral hygiene (dental health by state)
We calculated population density using U.S. Census data to determine the number of individuals per square mile—more people often means more odor.
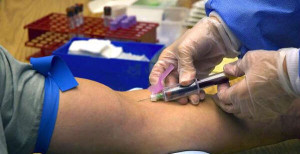
However, the hygiene practices of residents can vary greatly from state to state. We investigated dental hygiene across states, referencing a comprehensive study by WalletHub, which evaluated factors like dental visits and brushing frequency.
Continue reading to find out which states topped our smelliest rankings and which ones excelled in cleanliness.
1. Maryland

Landfills: 0.026%
People per Sq. Mile: 610
Unfortunately for Maryland residents, their state claims the title of the smelliest in the U.S. Contributing factors include a landfill percentage of 0.026%, poor air quality, and a high population density.
2. California
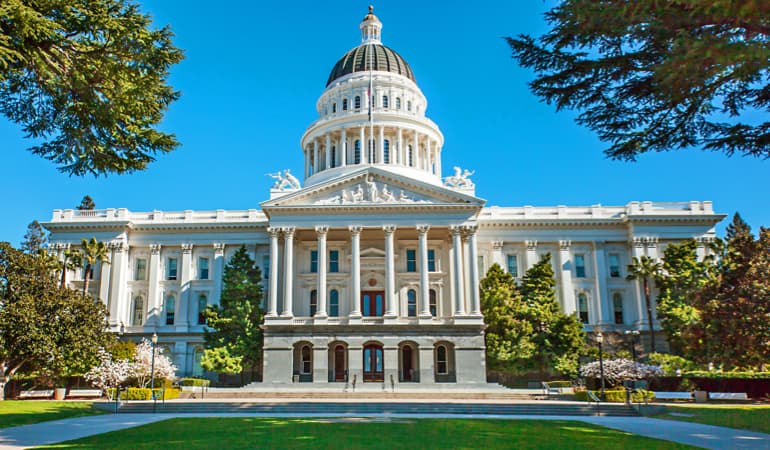
Landfills: 0.015%
People per Sq. Mile: 246.1
While California is often celebrated as the Golden State, its dental hygiene leaves much to be desired, contributing to its second-place odor ranking.
3. Florida

Landfills: 0.017%
People per Sq. Mile: 364.6
When envisioning Florida, many think of its stunning beaches, yet this state also has some less-than-pleasant aromas according to our rankings.
4. Delaware

Landfills: 0.040%
People per Sq. Mile: 475.1
Delaware’s high population density—475 people per square mile—means many individual smells combine to create a less-than-pleasant atmosphere.
5. Massachusetts

Landfills: 0.021%
People per Sq. Mile: 858
Massachusetts doesn’t rely on a single factor to earn its fifth-place ranking; a combination of air quality issues, landfill space, and population density create the state’s less-than-pleasant aroma.
6. Alabama

Landfills: 0.006%
People per Sq. Mile: 95.4
Alabama’s 6th place ranking stems from both poor air quality and inadequate access to dental care, leading to unpleasant odors.
7. New Jersey

Landfills: 0.042%
People per Sq. Mile: 1,210.10
New Jersey’s small size combined with its high population density results in significant waste issues, as over 0.0421% of its land is dedicated to landfills.
8. New York

Landfills: 0.015%
People per Sq. Mile: 417
Known for its vibrant culture and natural beauty, New York also faces challenges with waste management and air quality.
9. Pennsylvania

Landfills: 0.019%
People per Sq. Mile: 285.5
Pennsylvania’s crowded population and landfill percentage result in a less-than-fresh environment.
10. Mississippi

Landfills: 0.004%
People per Sq. Mile: 63.7
Mississippi ranks 10th, primarily due to poor oral health statistics and limited dental care access.
Life isn’t always roses
Sometimes, life can be less than pleasant. For residents of the 10 states mentioned above, encounters with unpleasant odors may happen more frequently than in other areas of the country.
Below is the complete ranking of all 50 states, from smelliest to least:
| Rank | State | Landfills | People Per Sq. Mile | Air Quality Rank (Higher Is Worse) |
|---|---|---|---|---|
| 1 | Maryland | 0.0263% | 610 | 47 |
| 2 | California | 0.0153% | 246 | 41 |
| 3 | Florida | 0.0166% | 364 | 33 |
| 4 | Delaware | 0.0399% | 475 | 35 |
| 5 | Massachusetts | 0.0205% | 858 | 45 |
| 6 | Alabama | 0.0058% | 95 | 49 |
| 7 | New Jersey | 0.0421% | 1,210 | 27 |
| 8 | New York | 0.0146% | 417 | 23 |
| 9 | Pennsylvania | 0.0191% | 285 | 13 |
| 10 | Mississippi | 0.0035% | 63 | 39 |
| 11 | Arkansas | 0.0035% | 56 | 43 |
| 12 | North Carolina | 0.0119% | 202 | 21 |
| 12 | Connecticut | 0.0111% | 742 | 37 |
| 14 | Rhode Island | 0.0375% | 1,017 | 12 |
| 15 | Georgia | 0.0122% | 173 | 31 |
| 16 | Indiana | 0.0174% | 183 | 23 |
| 16 | Kentucky | 0.0086% | 111 | 17 |
| 18 | Louisiana | 0.0072% | 107 | 15 |
| 19 | South Carolina | 0.0105% | 158 | 11 |
| 19 | New Hampshire | 0.0079% | 147 | 29 |
| 21 | Michigan | 0.0079% | 175 | 43 |
| 22 | Tennessee | 0.0095% | 157 | 9 |
| 22 | Missouri | 0.0046% | 87 | 37 |
| 24 | Ohio | 0.0165% | 283 | 17 |
| 25 | Hawaii | 0.0060% | 218 | 29 |
| 26 | Texas | 0.0083% | 101 | 8 |
| 26 | Illinois | 0.0160% | 232 | 25 |
| 28 | Colorado | 0.0039% | 50 | 39 |
| 29 | Arizona | 0.0038% | 58 | 45 |
| 29 | Maine | 0.0013% | 43 | 49 |
| 31 | Virginia | 0.0136% | 209 | 5 |
| 32 | West Virginia | 0.0067% | 77 | 3 |
| 33 | Alaska | 0.0001% | 1 | 47 |
| 34 | Montana | 0.0004% | 7 | 35 |
| 35 | Nevada | 0.0016% | 25 | 31 |
| 36 | Oklahoma | 0.0034% | 56 | 15 |
| 37 | Minnesota | 0.0028% | 68 | 41 |
| 38 | New Mexico | 0.0013% | 17 | 25 |
| 39 | Iowa | 0.0045% | 55 | 21 |
| 40 | Nebraska | 0.0016% | 24 | 33 |
| 41 | Kansas | 0.0032% | 35 | 19 |
| 42 | Vermont | 0.0026% | 68 | 6 |
| 42 | Washington | 0.0038% | 104 | 4 |
| 44 | Oregon | 0.0019% | 40 | 14 |
| 45 | Utah | 0.0019% | 35 | 7 |
| 46 | Wisconsin | 0.0058% | 106 | 2 |
| 47 | Idaho | 0.0008% | 19 | 27 |
| 48 | Wyoming | 0.0004% | 6 | 1 |
| 49 | South Dakota | 0.0007% | 11 | 10 |
| 49 | North Dakota | 0.0007% | 10 | 19 |
Author
Kathy is the head of content at Zippia with a knack for engaging audiences. Prior to joining Zippia, Kathy worked at Gateway Blend growing audiences across diverse brands. She graduated from Troy University with a degree in Social Science Education.