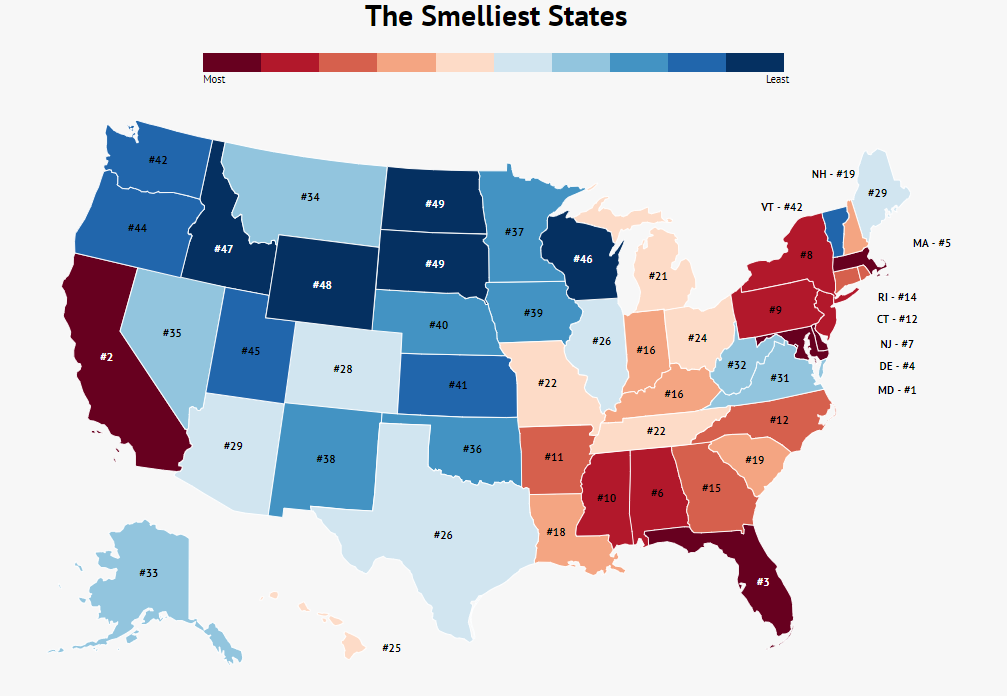
The smelliest state in the U.S. is Maryland, where 0.026% of land is landfills and there are 610 people per square mile.
Out of the top 10 smelliest states, New Jersey has the highest population density: 1,210.10 people per square mile.
Delaware has the highest percentage of land dedicated to landfills, at 0.0399%.
Alaska has the lowest percentage of land dedicated to landfills, at only 0.0001%.
What’s that smell?
Anyone who has ever taken a cross-country road trip knows that answer is sometimes “Maryland” and requires all the car windows to go up.
From landfills to the unbathed masses (yuck), sometimes states kind of stink. However, not all states are equally smelly.
But where are the smelliest places in the US? We set out to make smell a science and uncovered the states in dire need of deodorant. Keep reading to see what won these states the less-than-sought-after title of smelliest states in America.
How We Determined This
We started with undisputed metrics of gross-ery.
-
Dirty air
-
Trash, or the percentage of each state that is landfill
To measure the dirtiness of the air, we referred Air Filters Delivered thorough ranking on air quality. Cleaner air smells better.
For the trash rating, we simply used the EPA’s data on the percentage of each state’s land that is taken up by landfills.
From there, we decided to look into human smell factors. Because smell is other people:
-
Population density
-
Bad breath (Dental health by state)
First, we examined population density using population numbers from the US Census to find the number per square mile. The more people the smellier.
However, not all states take personal hygiene to the same lengths. In fact, some states are in dire need of some soap and Crest toothpaste. So, we sought to examine the dental hygiene of every state using a thorough study by Wallethub. This study looks into dental visits, brushing frequency, and other important oral hygiene factors.
Keep reading to see what set the 10 smelliest states apart (in a bad way) and where fared the best in our rankings.
1. Maryland
Landfills: 0.026%
People per Sq. Mile: 610
Sorry Marylanders, but Maryland is the smelliest state in the US. What makes Maryland pinch your nose smelly? Not only is 0.026% of the state pungent landfill, but there’s also the groddy air and a lot of people to smell up the place.
2. California
Landfills: 0.015%
People per Sq. Mile: 246.1
California may be the golden state, but I don’t think that nickname is supposed to refer to the teeth there. Unfortunately for people with good sense of smell, Californians don’t have great dental hygiene.
3. Florida
Landfills: 0.017%
People per Sq. Mile: 364.6
When you think of Florida, you might think of beautiful beaches or fun theme parks. However, judging from the rankings, you might should be thinking of air freshener.
4. Delaware
Landfills: 0.040%
People per Sq. Mile: 475.1
Delaware is pretty crowded. In fact, for every square mile there are 475 people living in the state. 475 people, and all of them with their own smells. And unfortunately, not all of them appreciate deodorant.
5. Massachusetts
Landfills: 0.021%
People per Sq. Mile: 858
No one factor alone makes Massachusetts the 5th smelliest state. However, mediocre air quality, more than their share of landfills, and plenty of people to stink up the place leave it less than fragrant.
6. Alabama
Landfills: 0.006%
People per Sq. Mile: 95.4
The 6th smelliest state is Alabama. What makes Alabama so smelly? This Southern state has some of the worst air quality in the nation. If that wasn’t bad enough, the state also has inadequate dental care. I don’t want a whiff of any of that.
7. New Jersey
Landfills: 0.042%
People per Sq. Mile: 1,210.10
The tiny, densely populated state of New Jersey has a trash problem. In fact, 0.0421% of the state is landfill- More than any other state in the country. To put that into perspective, Alaska only has 0.0001% of its land mass dedicated to being filled with trash.
8. New York
Landfills: 0.015%
People per Sq. Mile: 417
New York, New York…what a smelly state? New York may be wonderful and full of both beautiful nature and cultural landmarks but the state is also home to trash, mediocre air quality, and dubious dental hygiene. Yuck.
9. Pennsylvania
Landfills: 0.019%
People per Sq. Mile: 285.5
In 9th place is the state of Pennsylvania. Pennsylvania is a relatively crowded state with lots of residents to spice up the aroma. Of course, those residents also have a lot of trash- so much so the state is 0.019% landfill. While that might not be much of a good thing, it’s way too much smelly trash.
10. Mississippi
Landfills: 0.004%
People per Sq. Mile: 63.7
In 10th place is Mississippi. Mississippi has the worst oral health in the nation. Of course, with a lack of dental visits and flossing, comes bad breath. Wonder if they also lead in the amount of breath mints sold?
Life isn’t always roses
Sometimes life smells. Sometimes it smells enough breath mints, Febreeze, and rolled-up car windows can’t hide it.
Unfortunately, for residents in the 10 states above, life just might have more of those smelly moments than most other states’ residents have to put up with.
You can see the full ranking of all 50 states below, from smelliest to least:
| Rank | State | Landfills | People Per Sq. Mile | Air Quality Rank (Higher Is Worse) |
|---|---|---|---|---|
| 1 | Maryland | 0.0263% | 610 | 47 |
| 2 | California | 0.0153% | 246 | 41 |
| 3 | Florida | 0.0166% | 364 | 33 |
| 4 | Delaware | 0.0399% | 475 | 35 |
| 5 | Massachusetts | 0.0205% | 858 | 45 |
| 6 | Alabama | 0.0058% | 95 | 49 |
| 7 | New Jersey | 0.0421% | 1,210 | 27 |
| 8 | New York | 0.0146% | 417 | 23 |
| 9 | Pennsylvania | 0.0191% | 285 | 13 |
| 10 | Mississippi | 0.0035% | 63 | 39 |
| 11 | Arkansas | 0.0035% | 56 | 43 |
| 12 | North Carolina | 0.0119% | 202 | 21 |
| 12 | Connecticut | 0.0111% | 742 | 37 |
| 14 | Rhode Island | 0.0375% | 1,017 | 12 |
| 15 | Georgia | 0.0122% | 173 | 31 |
| 16 | Indiana | 0.0174% | 183 | 23 |
| 16 | Kentucky | 0.0086% | 111 | 17 |
| 18 | Louisiana | 0.0072% | 107 | 15 |
| 19 | South Carolina | 0.0105% | 158 | 11 |
| 19 | New Hampshire | 0.0079% | 147 | 29 |
| 21 | Michigan | 0.0079% | 175 | 43 |
| 22 | Tennessee | 0.0095% | 157 | 9 |
| 22 | Missouri | 0.0046% | 87 | 37 |
| 24 | Ohio | 0.0165% | 283 | 17 |
| 25 | Hawaii | 0.0060% | 218 | 29 |
| 26 | Texas | 0.0083% | 101 | 8 |
| 26 | Illinois | 0.0160% | 232 | 25 |
| 28 | Colorado | 0.0039% | 50 | 39 |
| 29 | Arizona | 0.0038% | 58 | 45 |
| 29 | Maine | 0.0013% | 43 | 49 |
| 31 | Virginia | 0.0136% | 209 | 5 |
| 32 | West Virginia | 0.0067% | 77 | 3 |
| 33 | Alaska | 0.0001% | 1 | 47 |
| 34 | Montana | 0.0004% | 7 | 35 |
| 35 | Nevada | 0.0016% | 25 | 31 |
| 36 | Oklahoma | 0.0034% | 56 | 15 |
| 37 | Minnesota | 0.0028% | 68 | 41 |
| 38 | New Mexico | 0.0013% | 17 | 25 |
| 39 | Iowa | 0.0045% | 55 | 21 |
| 40 | Nebraska | 0.0016% | 24 | 33 |
| 41 | Kansas | 0.0032% | 35 | 19 |
| 42 | Vermont | 0.0026% | 68 | 6 |
| 42 | Washington | 0.0038% | 104 | 4 |
| 44 | Oregon | 0.0019% | 40 | 14 |
| 45 | Utah | 0.0019% | 35 | 7 |
| 46 | Wisconsin | 0.0058% | 106 | 2 |
| 47 | Idaho | 0.0008% | 19 | 27 |
| 48 | Wyoming | 0.0004% | 6 | 1 |
| 49 | South Dakota | 0.0007% | 11 | 10 |
| 49 | North Dakota | 0.0007% | 10 | 19 |


