- Tech Industry Statistics
- MFA Statistics
- Streaming Services Statistics
- Mobile Vs. Desktop Usage Statistics
- AI Statistics
- Live Streaming Statistics
- Zoom Meeting Statistics
- Cord Cutting Statistics
- Digital Transformation Statistics
- Virtual Reality Statistics
- How Fast Is Technology Advancing
- Mobile Commerce Statistics
- SaaS Statistics
- Machine Learning Statistics
- Diversity In High Tech
- Cyber Security Statistics
- Ecommerce Statistics
- Tech Industry
- Gaming Industry
- Renewable Energy Job Creation
- Smartphone Industry
- Cybercrime Statistics
- Amazon Statistics
- Personalization Statistics
Research Summary. The smartphone landscape in the United States continues to evolve, with device dependency reaching new heights. As of 2026, smartphones are integral to daily communication, connectivity, and information access for millions. Our latest analysis reveals:
-
There are approximately 332 million smartphone users in the United States as of 2026.
-
90% of American adults now utilize smartphones.
-
About 51% of web traffic in the U.S. originates from mobile devices.
-
Apple remains the leading smartphone brand, boasting over 120 million iPhone users.
For a more in-depth analysis, explore our data breakdowns:
Demographics | Trends | Usage | Mobile Internet | Operating System
General U.S. Smartphone Industry Statistics
-
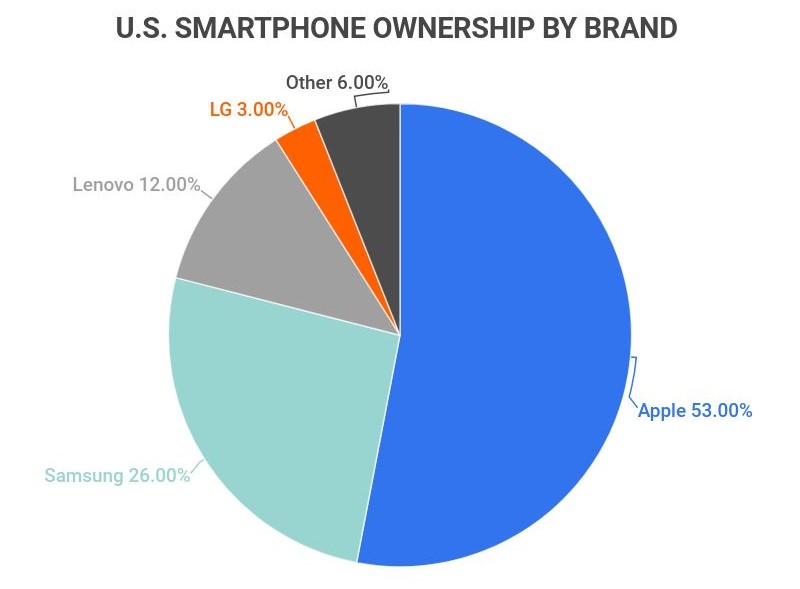
Apple leads the U.S. smartphone market.
As of the latest quarter, Apple commands a substantial market share of 55%. Following Apple, Samsung holds 25%, Lenovo accounts for 10%, and LG has 2% of the smartphone market.
-
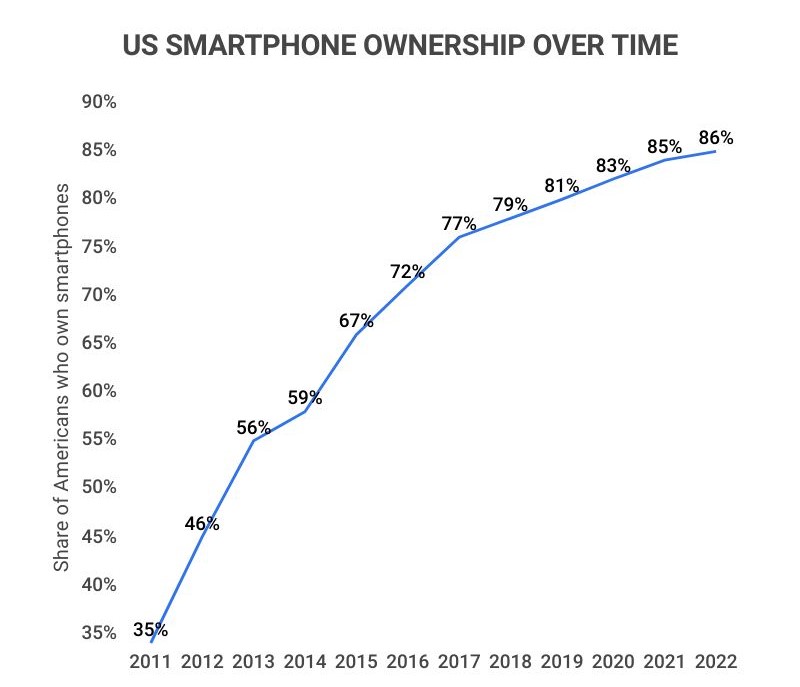
10% of Americans still use non-smart mobile phones.
While 90% of Americans own smartphones, around 10% still rely on non-smart mobile phones. The smartphone adoption rate has surged by 60% since 2011, when only 35% of Americans had smartphones.
-
The global smartphone industry generates approximately $495 billion annually.
China continues to lead the global market, generating over $140 billion in sales per year, while the United States contributes around $60 billion to the global smartphone market.
-
1.5 billion smartphones were sold globally in 2023.
On average, 1.4 to 1.6 billion smartphones are sold each year, with 2023 seeing a significant rebound in sales compared to previous years.
-
The global smartphone market is projected to grow at a compound annual growth rate of 12%.
The market was valued at $520 billion in 2021 and is expected to reach over $1 trillion by 2028.
U.S. Smartphone Industry Statistics by Demographics
-
An estimated 97% of individuals aged 18 to 29 own a smartphone, compared to 65% of those aged 65 and older.
-
Smartphone ownership among racial demographics shows 90% of White and Hispanic individuals and 87% of Black individuals own a smartphone.
-
Both men and women have an ownership rate of 90%, with approximately 99% of women and 98% of men owning a cell phone of any kind.
-
Higher-income individuals are more likely to own smartphones, with 80% of those earning less than $30,000 per year owning a smartphone compared to 98% of those earning $75,000 or more annually.
-
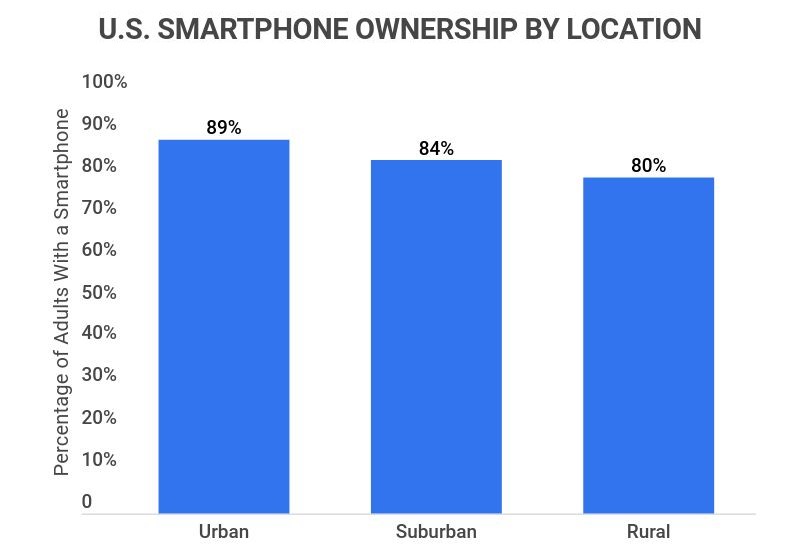
Smartphone ownership is prevalent in urban (90%), suburban (88%), and rural (82%) areas.
U.S. Smartphone Industry Trends and Predictions
-
Smartphone ownership in the U.S. has increased significantly over the last decade.
As of early 2026, 90% of Americans own a smartphone, a substantial rise from just 35% in 2011.
-
Smartphone ownership is more prevalent in developed regions compared to emerging economies.
In advanced economies, smartphone ownership averages 80%, while in emerging markets, it hovers around 50%. Countries like India have lower rates, with only about 35% ownership, compared to South Korea’s 98% ownership rate.
-
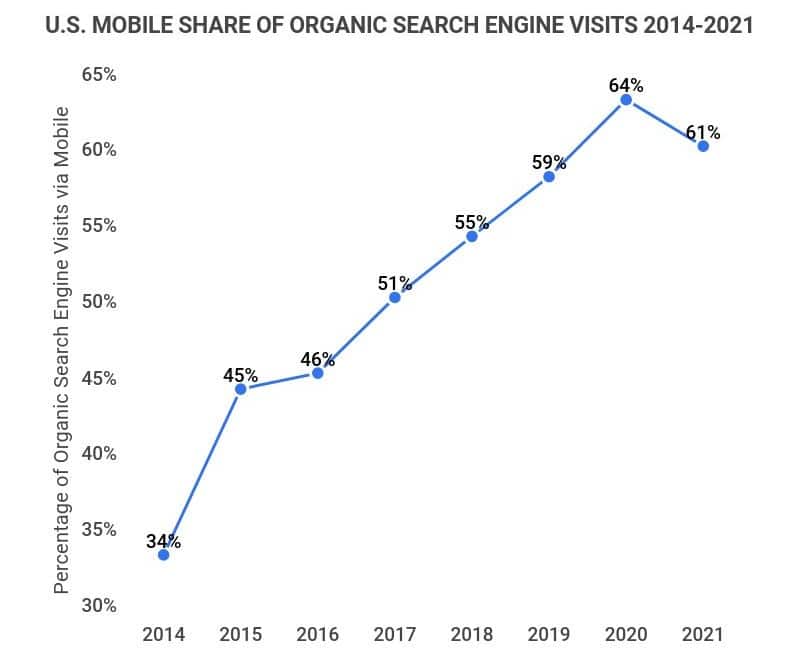
Mobile searches account for 65% of all organic search engine traffic in the U.S.
Recent statistics indicate that mobile devices conducted the majority of organic search engine visits, with 230 million users engaged in mobile search in 2023.
Furthermore, mobile devices accounted for 60% of total Google search clicks in recent years.
U.S. Smartphone Statistics by Usage
-
On average, a smartphone user interacts with their device over 2,500 times daily.
Users tap or swipe their phones approximately 2,750 times a day, while the most active users engage with their devices over 6,000 times daily.
-
Americans spend an average of 2 hours and 30 minutes on their smartphones each day.
Studies indicate that the average user engages in about 80 phone sessions daily, with Android users averaging around 145 minutes of screen time.
-
90% of Americans own a smartphone, and nearly all have cell phones.
As reported by Pew Research Center, 99% of Americans possess some form of cell phone, with 90% owning smartphones.
-
A significant number of U.S. adults report they cannot live without their smartphones.
48% of adults indicated they could not go a day without their smartphones, and a survey revealed that 93% of respondents value their smartphones as much as their cars.
U.S. Smartphone Industry Statistics by Mobile Internet
-
Approximately 1 in 6 Americans only access the internet via mobile devices.
15% of U.S. adults are smartphone-only internet users, a rise from 8% in 2013. Young adults aged 18 to 29 are the most likely to fall into this category, with 30% relying solely on smartphones for internet access.
-
In the U.S., 51% of web traffic originates from mobile devices.
This figure has seen steady growth, rising from 40% in 2018, showcasing the increasing shift towards mobile internet usage.
-
Smartphones are vital for shopping.
85% of U.S. shoppers utilize their smartphones for shopping, particularly for food and entertainment, with 36% using their devices to compare prices while in retail stores.
U.S. Smartphone Statistics by Operating System
-
The majority of smartphone users in North America own Apple devices.
Approximately 54% of smartphone users in the U.S. utilize Apple iPhones, compared to 43% who use Android devices, with only 3% on other operating systems.
The market share has shifted since 2019 when Apple and Android had almost equal users.
U.S. Smartphone Industry FAQ
-
How many people own smartphones in the United States?
Approximately 332 million people own smartphones in the United States, representing about 90% of the population. This marks a significant increase from 2011, when only 35% of Americans owned smartphones.
-
What country has the most cell phones?
Macau, China, boasts the highest number of cell phones per capita, with 343.11 mobile phones. It ranks alongside Hong Kong (287.85), the Gaza Strip (215.58), the United Arab Emirates (197.65), and Seychelles (196.79) for top cell phone density globally.
The U.S. has a lower ranking, with 122.81 mobile phones per capita.
-
How big is the smartphone industry?
The global smartphone industry is valued at approximately $495 billion in annual revenue. In 2023, around 1.5 billion smartphones were sold, indicating robust market growth.
-
Who is leading the smartphone market?
Samsung maintains its lead in the global smartphone market, while Apple dominates in the United States. Sales dynamics often shift seasonally, favoring Apple during the holiday quarters.
-
Which phone is most used in the world?
The iPhone 14 emerged as the best-selling smartphone globally in 2022. While exact usage figures are harder to pinpoint, the iPhone 14 accounted for 19% of total smartphone sales in the U.S.
-
Is the smartphone industry growing?
Absolutely, the smartphone industry is on an upward trajectory. Recent forecasts suggest the global smartphone market will expand by 9.5% annually until 2027, potentially reaching a value of $1 trillion.
Conclusion
The reliance on smartphones continues to shape our daily lives, with a staggering 332 million users in the U.S. and nearly 90% of adults engaging with these devices regularly. With the smartphone industry generating an estimated $495 billion annually, the significance of these devices is undeniable.
As mobile devices account for over half of web traffic and nearly half of U.S. adults report they cannot live without their smartphones, it’s clear that the future of the smartphone market is poised for continued growth. With projections indicating a compound annual growth rate of 12%, the smartphone industry is set for a prosperous future.
References
-
Pew Research Center. “Mobile Fact Sheet.” Accessed on September 8, 2023.
-
Counter Point Research. “U.S. Smartphone Market Share: By Quarter.” Accessed on September 8, 2023.
-
Statista. “Share of U.S. Mobile Website Traffic 2015-2023.” Accessed on September 8, 2023.
-
Statista. “Smartphone Sales Revenue Worldwide 2013-2023.” Accessed on September 8, 2023.
-
Globe Newswire. “Smartphone Market To Garner USD 2,297.8 Billion At A 16.4% CAGR By 2025—Report By Market Research Future.” Accessed on September 9, 2023.
-
Pew Research Center. “Smartphone Ownership Is Growing Rapidly Around The World, But Not Always Equally.” Accessed on September 8, 2023.
-
Statista. “Mobile Search — Statistics Facts.” Accessed on September 9, 2023.
-
Business Insider. “Here’s How Many Times We Touch Our Phones Every Day.” Accessed on September 9, 2023.
-
USA Today. “47% Of Adults Couldn’t Last A Day Without Smartphone, Survey Says.” Accessed on September 9, 2023.
-
Statista. “Share Of Mobile Operating Systems In North America 2018-2023, By Month.” Accessed on September 9, 2023.
- Tech Industry Statistics
- MFA Statistics
- Streaming Services Statistics
- Mobile Vs. Desktop Usage Statistics
- AI Statistics
- Live Streaming Statistics
- Zoom Meeting Statistics
- Cord Cutting Statistics
- Digital Transformation Statistics
- Virtual Reality Statistics
- How Fast Is Technology Advancing
- Mobile Commerce Statistics
- SaaS Statistics
- Machine Learning Statistics
- Diversity In High Tech
- Cyber Security Statistics
- Ecommerce Statistics
- Tech Industry
- Gaming Industry
- Renewable Energy Job Creation
- Smartphone Industry
- Cybercrime Statistics
- Amazon Statistics
- Personalization Statistics
Author
Chris Kolmar is a co-founder of Zippia and the editor-in-chief of the Zippia career advice blog. He has hired over 50 people in his career, been hired five times, and wants to help you land your next job. His research has been featured on the New York Times, Thrillist, VOX, The Atlantic, and a host of local news. More recently, he's been quoted on USA Today, BusinessInsider, and CNBC.