- Income Statistics
- Average PTO Days
- What Percentage of Americans Live Paycheck to Paycheck?
- Average American Income
- Millionaire Statistics
- Average Salary out of College
- Average Bonus Statistics
- Minimum Wage Statistics
- Union Benefits Statistics
- Savings Statistics
- Average Annual Raise
- Income Inequality Statistics
- How Many People Make Over 100k?
- Average 401(k) Sstatistics
- Average Net Worth Statistics
- $100k After-Tax Income By State
- Average Global Income
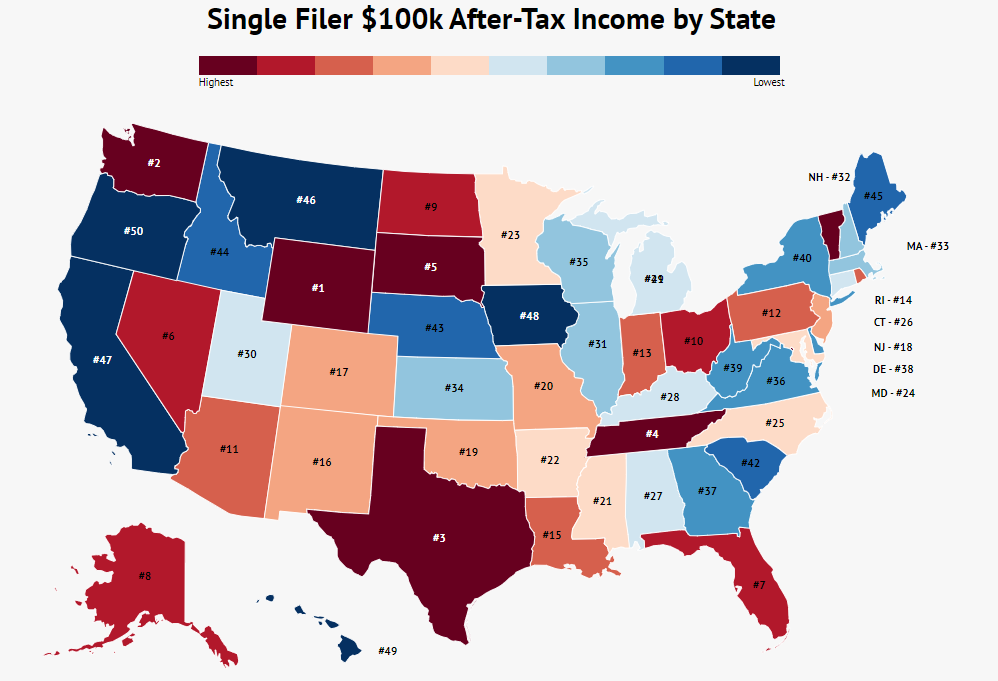
Research Summary: Tax season often brings to light how much of our hard-earned income is allocated to taxes. While these funds contribute to essential public services and infrastructure, the impact on your take-home pay can be significant.
States differ substantially in their tax rates, with some requiring thousands more in taxes than others. This disparity can influence your financial planning, especially in 2026, where cost-of-living adjustments have made budgeting even more critical.
To better understand how a $100k income translates into after-tax earnings across the United States, we examined all 50 states. Our findings reveal:
| State | Single filer take-home salary | Married filer take-home salary |
|---|---|---|
| Alabama | $72,747 | $79,324 |
| Alaska | $77,582 | $83,869 |
| Arizona | $74,574 | $81,765 |
| Arkansas | $73,036 | $79,444 |
| California | $71,295 | $80,634 |
| Colorado | $73,552 | $80,434 |
| Connecticut | $72,785 | $79,269 |
| Delaware | $72,213 | $78,714 |
| Florida | $77,582 | $83,869 |
| Georgia | $72,269 | $78,699 |
| Hawaii | $70,260 | $77,473 |
| Idaho | $71,815 | $79,265 |
| Illinois | $72,632 | $78,919 |
| Indiana | $74,352 | $80,639 |
| Iowa | $71,199 | $77,751 |
| Kansas | $72,510 | $79,511 |
| Kentucky | $72,716 | $79,138 |
| Louisiana | $73,913 | $80,781 |
| Maine | $71,779 | $79,283 |
| Maryland | $72,994 | $79,392 |
| Massachusetts | $72,582 | $78,869 |
| Michigan | $72,025 | $79,344 |
| Minnesota | $72,997 | $79,399 |
| Mississippi | $73,064 | $80,050 |
| Missouri | $73,064 | $80,050 |
| Montana | $71,599 | $78,217 |
| Nebraska | $71,891 | $79,700 |
| Nevada | $77,582 | $83,869 |
| New Hampshire | $72,582 | $78,869 |
| New Jersey | $73,336 | $81,118 |
| New Mexico | $73,596 | $80,646 |
| New York | $72,124 | $79,282 |
| North Carolina | $72,896 | $79,748 |
| North Dakota | $76,177 | $82,977 |
| Ohio | $75,019 | $81,306 |
| Oklahoma | $73,304 | $80,047 |
| Oregon | $69,039 | $75,784 |
| Pennsylvania | $74,512 | $80,799 |
| Rhode Island | $73,914 | $80,631 |
| South Carolina | $72,011 | $79,205 |
| South Dakota | $77,582 | $83,869 |
| Tennessee | $77,582 | $83,869 |
| Texas | $77,582 | $83,869 |
| Utah | $72,669 | $78,994 |
| Vermont | $72,681 | $80,244 |
| Virginia | $72,348 | $78,894 |
| Washington | $77,582 | $83,869 |
| West Virginia | $72,207 | $78,494 |
| Wisconsin | $72,403 | $79,414 |
| Wyoming | $77,582 | $83,869 |
For further analysis, we’ve categorized the data in the following ways:
Largest After-Tax | No Income Tax | Most Expensive
States With The Largest After-Tax Income
As of 2026, eight states provide an average after-tax income of over $77k for single filers and over $83k for married filers on a $100k income. Many of these states benefit from low or no income taxes, although other factors also contribute to higher take-home pay. To explore these financially advantageous states, here is a list:
-
Alaska: No income tax and annual dividends from mineral royalties make this state financially appealing.
-
Florida: Enjoys the benefit of no state income tax.
-
Nevada: Lacks an income tax but has a comparatively high sales tax rate of 5%.
-
South Dakota: No income tax and a lower sales tax rate than many states.
-
Tennessee: While there is no income tax, it has one of the highest sales tax rates in the nation.
-
Texas: No income tax, but a higher sales tax rate applies.
-
Washington: Lacks an income tax, though this is balanced by a combined federal and state tax burden of 22.42%.
-
Wyoming: Features no income tax.
If you want to delve deeper into after-tax income for the states without an income tax, here is a useful chart:
States With No Income Tax
| State | Single filer take-home salary | Married filer take-home salary |
|---|---|---|
| Alaska | $77,582 | $83,869 |
| Florida | $77,582 | $83,869 |
| Nevada | $77,582 | $83,869 |
| New Hampshire | $72,582 | $78,869 |
| South Dakota | $77,582 | $83,869 |
| Tennessee | $77,582 | $83,869 |
| Texas | $77,582 | $83,869 |
| Washington | $77,582 | $83,869 |
| Wyoming | $77,582 | $83,869 |
The Top 10 Most Expensive After-Tax Income States
Oregon ranks as the state with the most expensive after-tax income. Here, a single filer earning $100k can expect a take-home pay of just under $70k. Various states may present different financial dynamics for single versus married filers; below is our list of the ten most tax-unfriendly states:
| Rank | State | Single filer take-home salary | Married filer take-home salary | $100k Income Tax |
|---|---|---|---|---|
| 1 | Oregon | $69,039 | $75,784 | 4.75%-9.00% |
| 2 | Hawaii | $70,260 | $77,473 | 1.40%-11.0% |
| 3 | Iowa | $71,199 | $77,751 | 8.53% |
| 4 | California | $71,295 | $80,634 | 9.30% |
| 5 | Montana | $71,599 | $78,217 | 6.90% |
| 6 | Maine | $71,779 | $79,283 | 5.80% |
| 7 | Idaho | $71,815 | $79,265 | 5.77% |
| 8 | Nebraska | $71,891 | $79,700 | 5.84%-6.84% |
| 9 | West Virginia | $72,207 | $78,494 | 3.00%-6.50% |
| 10 | Delaware | $72,213 | $78,714 | 6.60% |
$100k After-Tax Income By State FAQ
-
How much federal tax should I pay if I make 100K?
Expect to pay roughly 25% of your income in federal taxes on a $100k salary. More specifically, your tax rate may range from 18%-24%. Typically, this means you could pay between $17,836 and $18,916 in federal taxes.
Keep in mind that federal taxes apply regardless of whether you reside in a state without an income tax.
-
Which state has the highest income tax?
California boasts the highest top-rate income tax, reaching 13.3%. This rate applies to those earning over $1 million in income.
Other states with elevated tax rates include:
-
Hawaii: 11.00%
-
New Jersey: 10.75%
-
Oregon: 9.90%
-
Minnesota: 9.85%
-
New York: 8.82%
-
Vermont: 8.75%
-
Iowa: 8.53%
-
Wisconsin: 7.65%
-
-
Which state has the highest tax burden?
New York holds the title for the highest tax burden, averaging a total of 12.75%. This encompasses property taxes, sales tax, and income tax. The following states also have high tax burdens:
-
Hawaii: 12.70%
-
Maine: 11.42%
-
Vermont: 11.13%
-
Minnesota: 10.20%
-
New Jersey: 10.11%
-
Connecticut: 10.06%
-
Rhode Island: 9.91%
-
California: 9.72%
-
Illinois: 9.70%
-
-
Which state has the lowest tax burden?
Alaska has the lowest tax burden, averaging just 5.06%. This figure reflects the absence of an income tax and a low sales tax of 1.52%. Here are other states with minimal tax burdens:
-
Tennessee: 5.75%
-
Delaware: 6.22%
-
Wyoming: 6.32%
-
New Hampshire: 6.41%
-
South Dakota: 7.12%
-
Montana: 7.39%
-
Alabama: 7.41%
-
Oklahoma: 7.47%
-
Idaho: 7.59%
-
Conclusion
While federal income taxes are unavoidable, your state of residence can significantly affect your take-home income. Among the 50 states, Alaska, Florida, Nevada, South Dakota, Tennessee, Texas, Washington, and Wyoming provide the highest after-tax incomes, primarily due to their lack of state income tax.
In contrast, Oregon emerges as the most expensive state for after-tax income for those earning $100k, with single filers taking home an average of just $69,039. Other high-tax burdens are experienced in states like Hawaii, Iowa, California, and Montana.
Ultimately, it’s crucial to weigh the benefits and drawbacks of each state’s tax structure. States without income tax often compensate with higher sales or property taxes, while states with higher taxes may offer enhanced public services. Conducting thorough research based on your personal and financial circumstances will help you choose the state that best aligns with your needs.
- Income Statistics
- Average PTO Days
- What Percentage of Americans Live Paycheck to Paycheck?
- Average American Income
- Millionaire Statistics
- Average Salary out of College
- Average Bonus Statistics
- Minimum Wage Statistics
- Union Benefits Statistics
- Savings Statistics
- Average Annual Raise
- Income Inequality Statistics
- How Many People Make Over 100k?
- Average 401(k) Sstatistics
- Average Net Worth Statistics
- $100k After-Tax Income By State
- Average Global Income
Author
Jack Flynn is a writer for Zippia. In his professional career he’s written over 100 research papers, articles and blog posts. Some of his most popular published works include his writing about economic terms and research into job classifications. Jack received his BS from Hampshire College.