Find a Job You Really Want In
Starting a new job can bring on a wave of anxiety. However, some locations in Kentucky face unique stressors that extend beyond the typical first-day jitters.
Longer commutes, increased work hours, and the ongoing challenge of job searches contribute to heightened stress levels in various cities. But which places in Kentucky are experiencing the most significant stress?
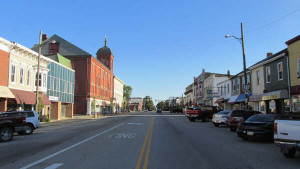
It appears that Bardstown has earned the title of the most stressed city in Kentucky, leading a list of the top ten most stressed locations in the Bluegrass State:
- Bardstown
- Covington
- Dayton
- Newport
- Nicholasville
- Mayfield
- La Grange
- Winchester
- Shelbyville
- Harrodsburg
Continue reading to discover why these Kentucky cities are in dire need of stress relief.
For more insights into Kentucky’s job market, explore:
Measuring Stress in Kentucky: Our Methodology
To assess stress levels, we identified six key factors that contribute to stress for many individuals and analyzed the 78 locations in Kentucky with populations over 5,000, based on the most recent American Community Survey data:
- Percentage of residents with long commutes (over 30 minutes)
- Unemployment Rate
- Average hours worked
- Population density
- Percentage of income spent on housing
- Percentage of residents without health insurance
The higher any of these indicators, the greater the stress level within that community.
Our data is sourced from the U.S. Census’ American Community Survey for the latest available period.
We ranked each location from 1 to 78 (with 1 being the most stressed) across these six criteria, averaging the ranks to produce a Stress Score. The location with the lowest score is deemed the most stressed out in Kentucky.
Next, we delve into the specific stress statistics for each of the top ten most stressed places, followed by a comprehensive ranking of all 78 locations analyzed.
1. Bardstown
Population: 12,833 Residents with High Rent: 63.7%
Residents with Long Commute: 31.6%
Residents Without Insurance: 16.8%
2. Covington
Population: 40,712 Residents with High Rent: 51.9%
Residents with Long Commute: 23.9%
Residents Without Insurance: 18.4%
3. Dayton
Population: 5,382 Residents with High Rent: 59.2%
Residents with Long Commute: 24.3%
Residents Without Insurance: 17.3%
4. Newport
Population: 15,467 Residents with High Rent: 44.2%
Residents with Long Commute: 22.7%
Residents Without Insurance: 20.9%
5. Nicholasville
Population: 28,483 Residents with High Rent: 43.5%
Residents with Long Commute: 39.1%
Residents Without Insurance: 15.4%
6. Mayfield
Population: 10,091 Residents with High Rent: 56.3%
Residents with Long Commute: 23.1%
Residents Without Insurance: 19.4%
7. La Grange
Population: 8,283 Residents with High Rent: 52.2%
Residents with Long Commute: 43.1%
Residents Without Insurance: 16.2%
8. Winchester
Population: 18,363 Residents with High Rent: 43.9%
Residents with Long Commute: 30.9%
Residents Without Insurance: 15.6%
9. Shelbyville
Population: 14,558 Residents with High Rent: 46.5%
Residents with Long Commute: 32.3%
Residents Without Insurance: 21.5%
10. Harrodsburg
Population: 8,359 Residents with High Rent: 54.9%
Residents with Long Commute: 25.0%
Residents Without Insurance: 13.6%
Comprehensive List of Stressed Cities in Kentucky
Conclusion
Understanding the stress levels in various Kentucky cities is crucial for those considering relocation or job opportunities in the area. As highlighted, Bardstown leads the list, but multiple cities exhibit significant stress factors that could impact quality of life. Identifying these stressors can help future residents make informed decisions about their living situations.
Author
Chris Kolmar is a co-founder of Zippia and the editor-in-chief of the Zippia career advice blog. He has hired over 50 people in his career, been hired five times, and wants to help you land your next job. His research has been featured on the New York Times, Thrillist, VOX, The Atlantic, and a host of local news. More recently, he's been quoted on USA Today, BusinessInsider, and CNBC.