The Worst States For Single Men Looking For A Date (And The Best)
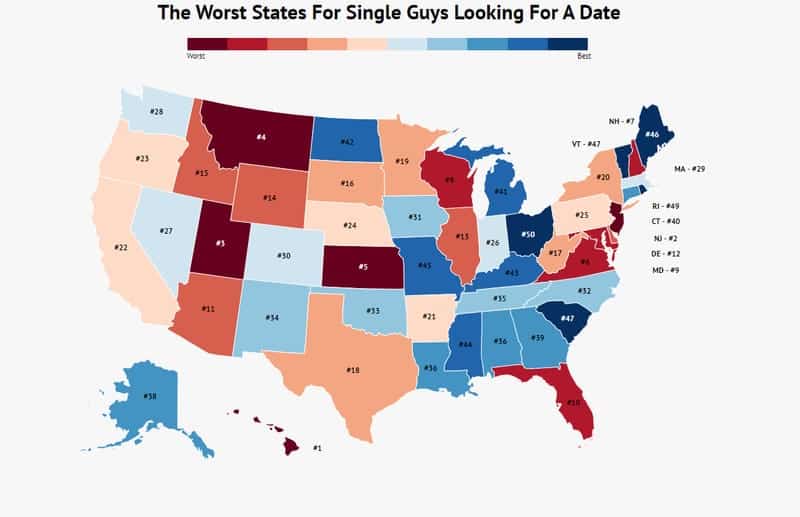
The most challenging state for single men in the U.S. is Hawaii, where there are 100.1 men for every 100 women and 35% of young adults live with their parents.
The most favorable state for single men in the U.S. is Ohio, where there are 96 men for every 100 women and only 30.56% live with their parents.
61% of single men are actively seeking dates, compared to just 38% of single women.
62% of individuals who have never been married are looking to date, compared to 43% who have been divorced and 25% who have been widowed.
Searching for love in less-than-ideal places? You’re not alone. Our analysis of all 50 states reveals where single men have the best opportunities to find love (or at least a solid date). If you’ve been struggling to land a date, it might not be all on you—location plays a significant role.
The Worst States For Single Men To Get A Date
If your state isn’t in the top 10, scroll down to see how single men are faring in your state’s dating scene. Keep reading to learn why these states are the most challenging for single men trying to find a date.
How We Determined The Worst States For Single Guys To Find A Date
We evaluated each state in four key areas:
-
Percentage Of Residents Married
-
Ratio Of Men To Women
-
Percentage Living With Their Parents
-
Affordability
Our data on marriage rates for each state was sourced from the American Community Survey. A lower marriage rate typically indicates a higher number of singles, creating better dating prospects for single men. While marriage rates may suggest that many men found lasting relationships, they don’t help those currently seeking dates.
The ratio of men to women also comes from the ACS—measuring the number of women per 100 men. Generally, a higher number of women compared to men increases dating opportunities. Furthermore, we analyzed data on the percentage of young adults living with their parents from the ACS. While dating from the parental home isn’t impossible, it certainly complicates things.
Lastly, we assessed affordability in each state. While going on dates is important, being able to afford them is crucial for success. For affordability, we compared cost of living against average wages as reported by the Bureau of Labor Statistics. The more disposable income after essential expenses, the more likely a man is to invest in grooming and dates beyond the standard Netflix and chill.
1. Hawaii

Marriage Rate: 50.7%
Men-to-Women Ratio: 100.1
Living with parents: 35%
Hawaii may be paradise on earth, but single men here face tough dating prospects. With a nearly equal number of men and women, competition is fierce. Coupled with the high cost of living, single men in Hawaii might think twice before making dinner reservations for Valentine’s Day—unless it’s a solo affair.
2. New Jersey

Marriage Rate: 53%
Men-to-Women Ratio: 95.4
Living with parents: 46%
New Jersey ranks as the second worst state for single men seeking dates. The high cost of living means dating expenses can take a toll on their wallets. Moreover, a significant number of adults living with their parents makes for less-than-ideal dating situations. This scenario often leads to brunches with mom and dad rather than romantic outings.
3. Utah

Marriage Rate: 57.2%
Men-to-Women Ratio: 101.5
Living with parents: 27.83%
Utah presents challenges for single men primarily due to a high marriage rate. Many men who delay marriage find themselves with limited dating options, compounded by a gender ratio that favors women, making dating even more challenging.
4. Montana

Marriage Rate: 53.1%
Men-to-Women Ratio: 101.4
Living with parents: 22.06%
Montana, often referred to as “The Last Best Place,” poses challenges for single men due to high marriage rates and a men-to-women ratio that is not in their favor, making it tough to find a date.
5. Kansas

Marriage Rate: 53.7%
Men-to-Women Ratio: 99.2
Living with parents: 24.10%
Kansas ranks fifth for single men struggling to find dates, primarily due to high marriage rates. If a Kansas man spots a potential date, he should check for wedding rings first—marriage is a common occurrence.
6. Virginia

Marriage Rate: 51.6%
Men-to-Women Ratio: 96.9
Living with parents: 32.06%
Virginia may not be the ideal destination for lovers. Despite a slightly favorable men-to-women ratio, the high cost of living leaves little room for dating expenses, requiring single men to be resourceful when planning outings.
7. New Hampshire

Marriage Rate: 52.4%
Men-to-Women Ratio: 97.4
Living with parents: 34.65%
New Hampshire presents an overall lack of favorable dating conditions for single men, with lackluster performances across key metrics. The high percentage of adults living with their parents certainly doesn’t help anyone’s dating prospects.
8. Wisconsin

Marriage Rate: 51.7%
Men-to-Women Ratio: 98.9
Living with parents: 27.03%
Wisconsin appears to be a charming place for a date, but single men know it’s not easy to land one. The competition can be fierce in this cheese-loving state.
9. Maryland
Marriage Rate: 50.8%
Men-to-Women Ratio: 94.2
Living with parents: 38.36%
In Maryland, single men might find themselves in perpetual singlehood. High living costs force many to work long hours, leaving little time or money for romantic dinners.
10. Florida

Marriage Rate: 48.4%
Men-to-Women Ratio: 95.5
Living with parents: 38.43%
Florida may be known as the Sunshine State, but single men often struggle to find dates. Many are living with their parents, which can complicate romantic pursuits. High living costs also contribute to this dating dilemma.
Summary Of The Worst States For Single Guys To Get A Date
Here you have it—the states where single men face the most challenges in finding dates. While it may be more difficult in these states, hope is not lost. Difficult doesn’t mean impossible! If things seem bleak, consider relocating to a state where single men have better dating prospects.
The best states for a single guy looking for a date?
Check out the full data below:
| Rank | State | # Of Men To 100 Women | ||
|---|---|---|---|---|
| 1 | Hawaii | 50 | 100 | 35.02% |
| 2 | New Jersey | 53 | 95 | 46.42% |
| 3 | Utah | 57 | 101 | 27.83% |
| 4 | Montana | 53 | 101 | 22.06% |
| 5 | Kansas | 53 | 99 | 24.1% |
| 6 | Virginia | 51 | 96 | 32.06% |
| 7 | New Hampshire | 52 | 97 | 34.65% |
| 8 | Wisconsin | 51 | 98 | 27.03% |
| 9 | Maryland | 50 | 94 | 38.36% |
| 10 | Florida | 48 | 95 | 38.43% |
| 11 | Arizona | 48 | 98 | 31.57% |
| 12 | Delaware | 50 | 93 | 37.18% |
| 13 | Illinois | 50 | 96 | 35.83% |
| 14 | Wyoming | 53 | 102 | 20.69% |
| 15 | Idaho | 55 | 101 | 24.88% |
| 16 | South Dakota | 53 | 101 | 19.03% |
| 17 | West Virginia | 50 | 98 | 32.28% |
| 18 | Texas | 50 | 98 | 33.15% |
| 19 | Minnesota | 52 | 99 | 26.44% |
| 20 | New York | 48 | 94 | 39.87% |
| 21 | Arkansas | 51 | 96 | 27.0% |
| 22 | California | 48 | 98 | 38.26% |
| 23 | Oregon | 51 | 98 | 25.37% |
| 24 | Nebraska | 54 | 99 | 21.72% |
| 25 | Pennsylvania | 50 | 96 | 35.99% |
| 26 | Indiana | 50 | 97 | 29.91% |
| 27 | Nevada | 46 | 100 | 30.89% |
| 28 | Washington | 52 | 100 | 26.13% |
| 29 | Massachusetts | 48 | 94 | 36.25% |
| 30 | Colorado | 51 | 101 | 24.36% |
| 31 | Iowa | 52 | 98 | 21.7% |
| 32 | North Carolina | 51 | 94 | 30.45% |
| 33 | Oklahoma | 51 | 97 | 25.81% |
| 34 | New Mexico | 46 | 98 | 34.34% |
| 35 | Tennessee | 51 | 95 | 30.48% |
| 36 | Louisiana | 46 | 95 | 33.65% |
| 36 | Alabama | 50 | 94 | 34.29% |
| 38 | Alaska | 50 | 108 | 29.26% |
| 39 | Georgia | 49 | 94 | 34.0% |
| 40 | Connecticut | 49 | 95 | 41.15% |
| 41 | Michigan | 49 | 97 | 34.01% |
| 42 | North Dakota | 50 | 106 | 14.46% |
| 43 | Kentucky | 51 | 96 | 28.89% |
| 44 | Mississippi | 47 | 94 | 36.06% |
| 45 | Missouri | 51 | 96 | 28.27% |
| 46 | Maine | 51 | 96 | 29.69% |
| 47 | Vermont | 49 | 96 | 27.65% |
| 47 | South Carolina | 49 | 94 | 32.63% |
| 49 | Rhode Island | 44 | 95 | 36.97% |
| 50 | Ohio | 49 | 96 | 30.56% |
Author
Kathy is the head of content at Zippia with a knack for engaging audiences. Prior to joining Zippia, Kathy worked at Gateway Blend growing audiences across diverse brands. She graduated from Troy University with a degree in Social Science Education.