Find a Job You Really Want In
When you think of “startup,” places like Silicon Valley, New York City, and Boston come to mind. These regions have been the hubs of innovation, attracting significant venture capital funding—around 40% of all funded startups are in the Bay Area alone, with NYC and Boston following closely with about 25% combined.
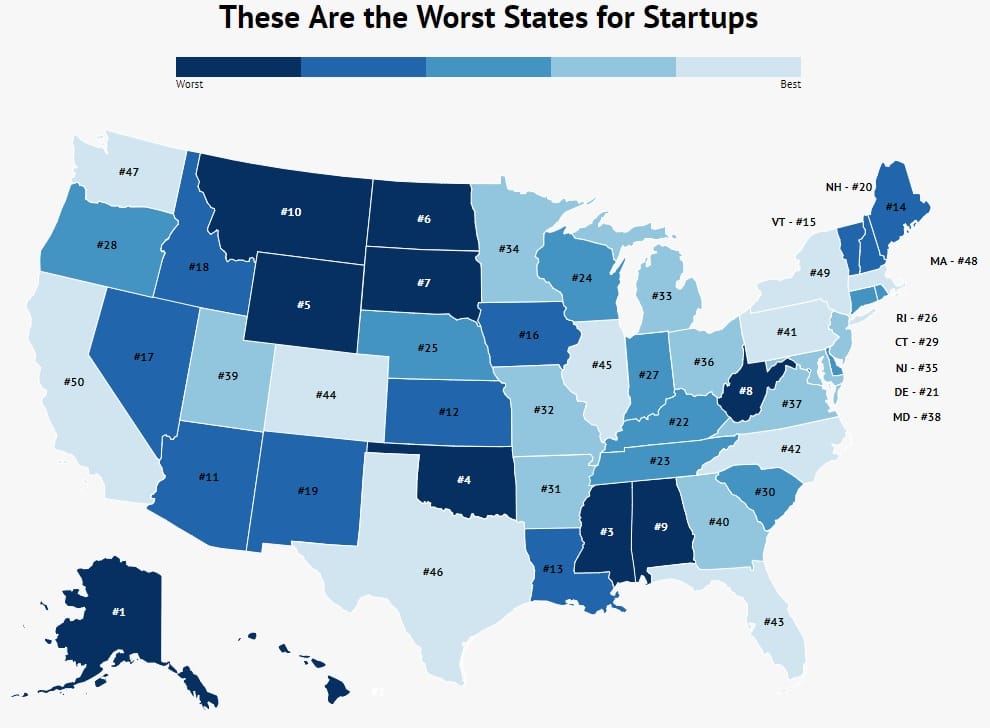
However, if you’re looking to launch your groundbreaking idea—be it a niche app or a new service—and want to avoid the crowded startup scenes of the coasts, you might want to consider where *not* to go. Here are the ten worst states for startups in 2026:
For a comprehensive overview of how all fifty states rank, check the full list at the bottom of the jobs page. First, let’s explore the qualities that the best states possess and what the bottom ten states lack.
Criteria for Ranking the Worst Startup States
Even with a unique product or service idea, the most critical factor for your startup’s success is access to funding. The proximity to venture capitalists (VCs) significantly impacts the likelihood of startup success.

Startups thrive where venture capital is abundant, creating a symbiotic relationship between VCs and startups. To assess the current landscape, we analyzed VC deal data from the past year, focusing on:
- The number of VC deals in each state
- The total dollar value of those deals
States were ranked based on these criteria, with scores combined for an overall ranking.
Why These States Are Challenging for Startups
The Bay Area’s prominence as a startup hub is largely due to its ecosystem of mentorship, talent, and capital. This clustering effect means startups are more successful when they are located near other successful ventures.
In many cases, startups outside of major hubs take longer to secure funding—averaging about 10% more time for Seed and Series A rounds compared to states like California, New York, and Massachusetts. This can translate to crucial delays in securing the necessary capital during vital growth phases.
Furthermore, startups often acquire other nearby companies, with a significant proportion of acquisitions occurring within the same state. For example, California has seen numerous acquisitions, which is substantially higher than expected based on its startup population alone.
The reasons for the poor startup environment in the worst states largely stem from a lack of financial resources and educational institutions. The primary challenges these states face include:
- Prolonged fundraising timelines.
- Decreased likelihood of acquisition.
- Lower overall success rates.
So, if you’re serious about making your startup venture a success, consider relocating to a more favorable environment, perhaps even the Bay Area.
The Worst States to Start a New Business
| State | Rank | Fewest VC Deals | Lowest VC Value |
|---|---|---|---|
| Alaska | 1 | 1 | 1 |
| Hawaii | 2 | 3 | 2 |
| Mississippi | 3 | 2 | 3 |
| Oklahoma | 4 | 4 | 4 |
| Wyoming | 5 | 5 | 6 |
| North Dakota | 6 | 6 | 7 |
| South Dakota | 7 | 8 | 5 |
| West Virginia | 8 | 9 | 8 |
| Alabama | 9 | 11 | 12 |
| Montana | 10 | 10 | 14 |
| Arkansas | 11 | 14 | 11 |
| Kansas | 12 | 16 | 10 |
| Louisiana | 13 | 13 | 13 |
| Maine | 14 | 7 | 20 |
| Vermont | 15 | 18 | 9 |
| Iowa | 16 | 21 | 15 |
| Nevada | 17 | 20 | 16 |
| Idaho | 18 | 12 | 27 |
| New Mexico | 19 | 15 | 24 |
| New Hampshire | 20 | 19 | 22 |
| Delaware | 21 | 23 | 19 |
| Kentucky | 22 | 17 | 25 |
| Tennessee | 23 | 27 | 17 |
| Wisconsin | 24 | 26 | 18 |
| Nebraska | 25 | 24 | 23 |
| Rhode Island | 26 | 22 | 26 |
| Indiana | 27 | 32 | 21 |
| Oregon | 28 | 29 | 28 |
| Connecticut | 29 | 28 | 30 |
| South Carolina | 30 | 25 | 34 |
| Arizona | 31 | 30 | 32 |
| Missouri | 32 | 31 | 31 |
| Michigan | 33 | 34 | 29 |
| Minnesota | 34 | 35 | 33 |
| New Jersey | 35 | 33 | 37 |
| Ohio | 36 | 38 | 35 |
| Virginia | 37 | 39 | 36 |
| Maryland | 38 | 37 | 40 |
| Utah | 39 | 36 | 41 |
| Georgia | 40 | 42 | 39 |
| Pennsylvania | 41 | 43 | 38 |
| North Carolina | 42 | 41 | 42 |
| Florida | 43 | 40 | 44 |
| Colorado | 44 | 45 | 43 |
| Illinois | 45 | 44 | 45 |
| Texas | 46 | 47 | 46 |
| Washington | 47 | 46 | 47 |
| Massachusetts | 48 | 48 | 48 |
| New York | 49 | 49 | 49 |
Author
David Luther was the Content Marketing Editor for the Zippia Advice blog. He developed partnerships with external reporting agencies in addition to generating original research and reporting for the Zippia Career Advice blog. David obtained his BA from UNC Chapel Hill.