Find a Job You Really Want In
In today’s job market, commuting can significantly affect your financial well-being.
With the rise of remote work and hybrid models, many employees are now realizing the financial advantages of working from home. Expenses like overpriced coffee, lunches with coworkers, and professional attire can add up quickly.
However, the most substantial cost comes from commuting. Recent data indicates that the average American worker spends about 27 minutes driving to work each day. That translates to 54 minutes daily spent on the road. When factoring in fuel costs and vehicle maintenance, this amounts to approximately $15 per day. Over a typical workweek, that totals $75, and annually, it can reach about $3,900.
Given these figures, it’s no wonder many workers prefer to continue working remotely.
Not all cities, however, come with such steep commuting costs. We’ve analyzed the numbers to identify where individuals are spending the largest portion of their paychecks just to get to work.
The Cities With The Most Expensive Commutes
- Palmdale, California
- New York, New York
- Moreno Valley, California
- Hialeah, Florida
- Stockton, California
- Pomona, California
- Newark, New Jersey
- Philadelphia, Pennsylvania
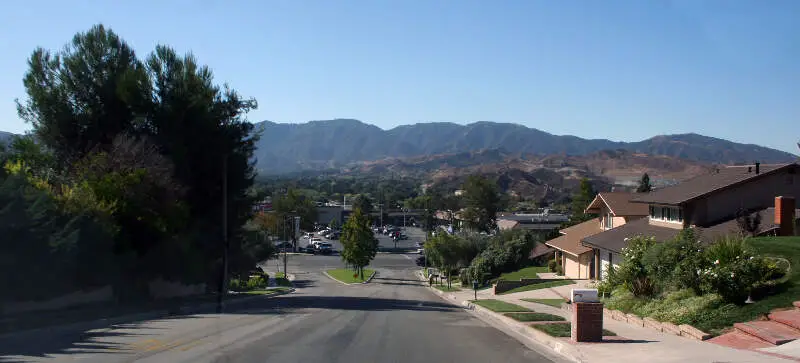
- Santa Clarita, California
- San Bernardino, California
It seems that California is leading the pack, with 6 out of the top 10 cities featuring high commuting costs. Read on to find out where your city ranks and how much it costs to work there.
How We Determined This
We analyzed over 200 cities with populations exceeding 100,000 to uncover those where residents endure the highest commuting costs.
Commuting costs were assessed through two key metrics:
- Commute time
- Vehicle wear and tear/fuel costs
The first metric was commute time. Time is essentially money, and the hours spent on the road are often unpaid. By using the median salary in each city, we calculated the hourly wage based on a typical 40-hour work week, excluding weekends and holidays.
Then, we multiplied that hourly wage by the average commute time from the American Community Survey (ACS) to quantify the financial opportunity cost of commuting. Since not everyone works a standard 40-hour week, these figures are slightly conservative.
For the wear and tear/fuel costs, we calculated that drivers travel approximately 1 mile for every 2 minutes spent driving each way. We applied the IRS standard mileage rate of 57 cents per mile to estimate costs.
To rank the cities, we calculated the percentage of each city’s median income spent on commuting, factoring in both direct commuting expenses and opportunity costs. The higher the percentage, the worse the ranking.
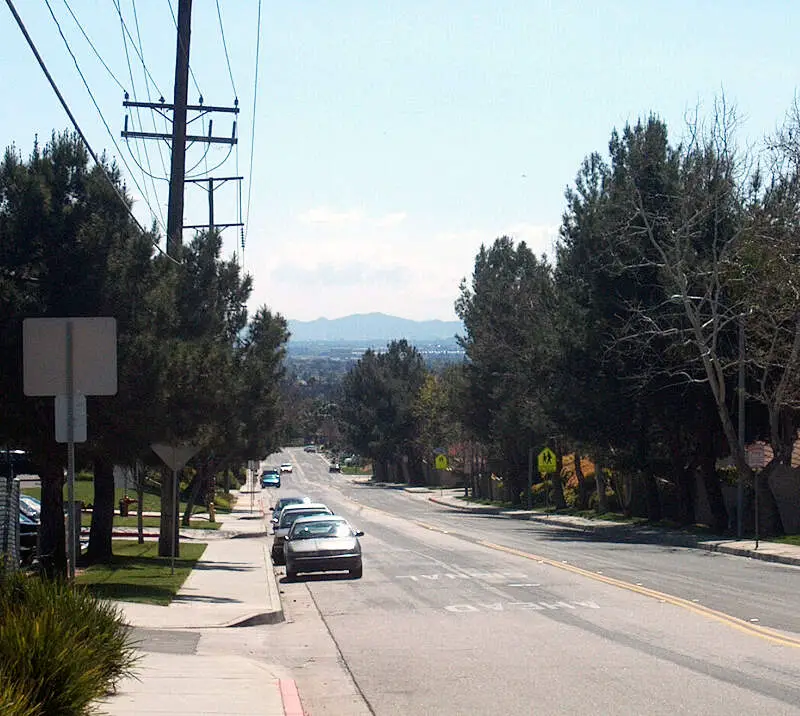
1. Palmdale, California

Hourly Wage: $15
Average Commute Length (Minutes): 86
Daily Commute Cost: $24.45
Palmdale boasts the nation’s most expensive commute, averaging an astounding $6,382.23 in annual expenses alone. Coupled with relatively low salaries, this presents a significant financial burden. Commuters here spend nearly an hour and a half daily on the road, equating to over 300 hours a year solely for commuting. Is the trade-off for spacious and affordable housing truly worth it?
2. New York, New York
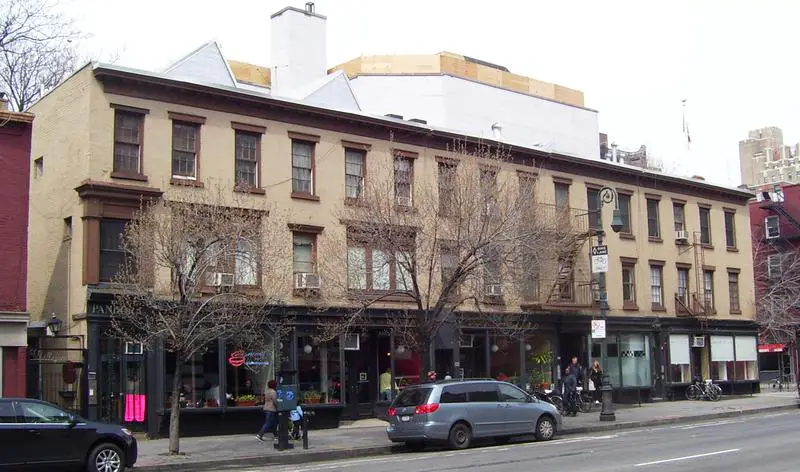
Hourly Wage: $20
Average Commute Length (Minutes): 84
Daily Commute Cost: $23.94
New York City is a vibrant place to live, but commuting is a challenge. Residents spend an average of 84 minutes each day getting to work. While salaries are generally high, commuting costs can often surpass the hourly wage, resulting in an hour of work just to afford the commute.
3. Moreno Valley, California
Hourly Wage: $14
Average Commute Length (Minutes): 72
Daily Commute Cost: $20.41
In Moreno Valley, workers face a significant daily commute. If they were compensated for those hours spent on the road, they could earn an additional $5,325.97 annually. Instead, many spend over an hour daily commuting.
4. Hialeah, Florida
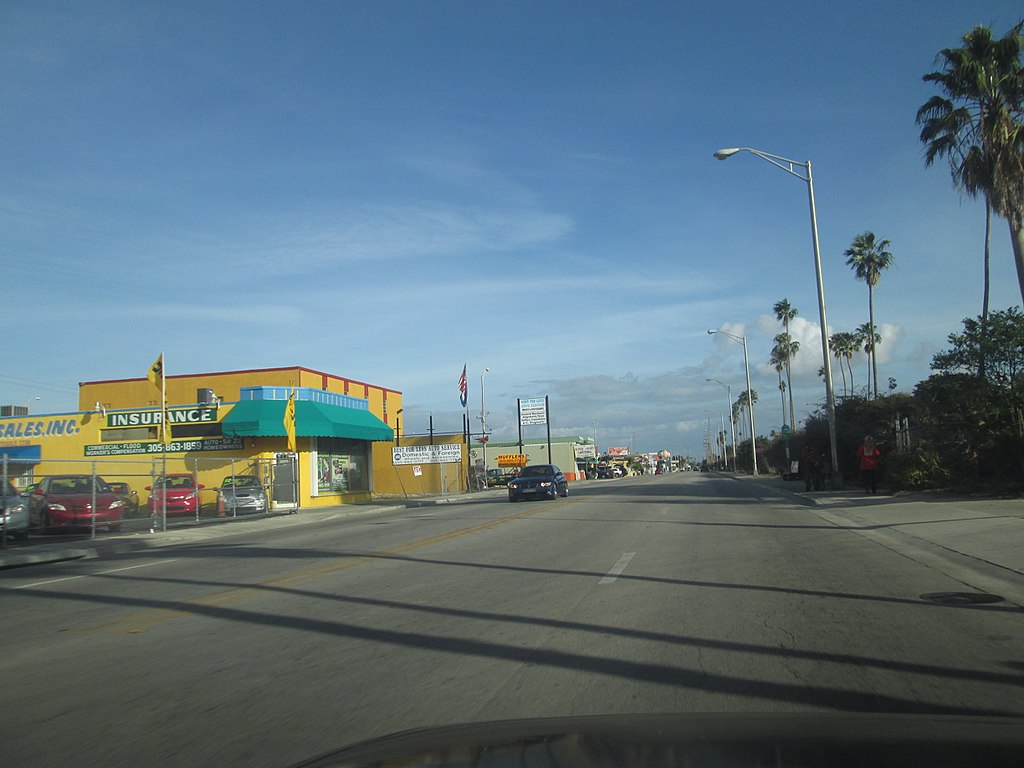
Hourly Wage: $12
Average Commute Length (Minutes): 64
Daily Commute Cost: $18.24
Many Hialeah workers commute to Miami, which involves a significant time investment. With the median income at $25,096, the costs associated with time and fuel take a large bite out of their paychecks.
5. Stockton, California

Hourly Wage: $15
Average Commute Length (Minutes): 69
Daily Commute Cost: $19.78
Stockton’s workers spend an average of 69 minutes commuting each day. The financial burden from gas and vehicle maintenance averages out to $19.78 daily, which can exceed their hourly wages.
6. Pomona, California

Hourly Wage: $12
Average Commute Length (Minutes): 63
Daily Commute Cost: $18.01
While Pomona’s commute length is not the worst, the relatively low median pay means workers feel the pinch of commuting costs and time lost.
7. Newark, New Jersey
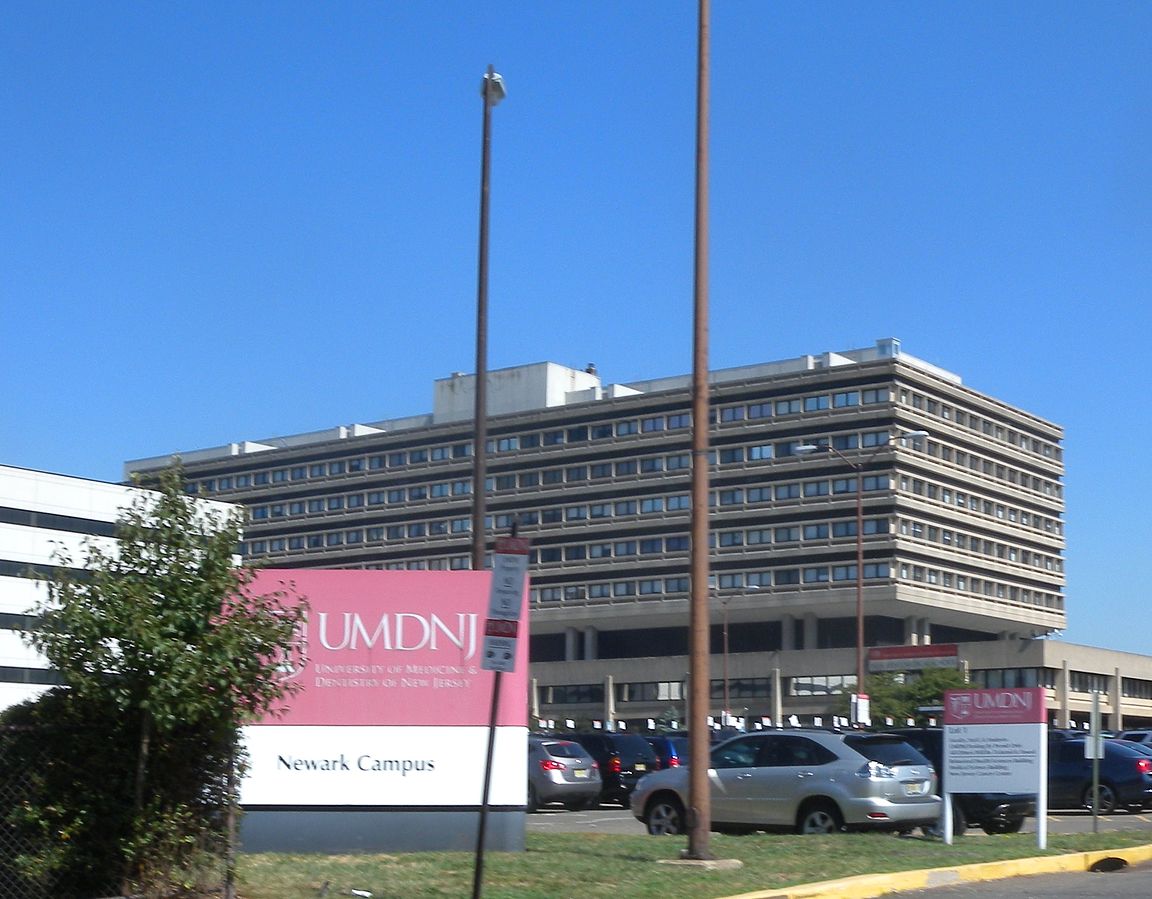
Hourly Wage: $14
Average Commute Length (Minutes): 67
Daily Commute Cost: $19.21
Newark workers spend just over an hour commuting daily, resulting in a significant financial outlay of about $19 each day.
8. Philadelphia, Pennsylvania

Hourly Wage: $16
Average Commute Length (Minutes): 69
Daily Commute Cost: $19.61
Philadelphia commuters spend an average of 69 minutes getting to and from work each day, which translates into both lost time and significant expenses.
9. Santa Clarita, California
Hourly Wage: $20
Average Commute Length (Minutes): 77
Daily Commute Cost: $21.89
Santa Clarita residents face a lengthy commute of 77 minutes, second only to Palmdale. Although wages are higher, commuting still consumes a significant portion of their time and income.
10. San Bernardino, California
Hourly Wage: $13
Average Commute Length (Minutes): 60
Daily Commute Cost: $17.10
San Bernardino’s commute ranks 10th, averaging an hour daily. This substantial time investment often exceeds the earnings from an hour’s work, making commuting a financial strain.
Keep Commuting Costs in Mind When Choosing a Job!
While a high-paying job 40 minutes away may initially sound appealing, you may find that a larger portion of your paycheck and time is consumed by commuting than you anticipated. Not only will you incur higher gas and maintenance costs, but you’ll also have less free time for personal pursuits or additional earning opportunities.
For those looking to minimize their commuting costs, we’ve compiled a list of cities where workers spend the least proportion of their paychecks on commuting expenses.
Cities Where Workers Spend The Least On Their Commute
- Sioux Falls, South Dakota
- Overland Park, Kansas
- Lubbock, Texas
- Anchorage, Alaska
- Sunnyvale, California
- Scottsdale, Arizona
- Midland, Texas
- Bellevue, Washington
- Amarillo, Texas
- Salt Lake City, Utah
While some of these cities enjoy relatively low traffic, others still see workers spending significant time on the road. For instance, cities like Bellevue, Washington and Sunnyvale, California stand out due to high salaries that offset commuting costs. This demonstrates that sometimes, the commute may be worth the trade-off.
The 50 Cities With The Most Expensive Commutes
| Rank | City | State | Average Commute Length (Minutes) | Daily Commute Cost |
|---|---|---|---|---|
| 1 | Palmdale | California | 85 | 24 |
| 2 | New York City | New York | 84 | 23 |
| 3 | Moreno Valley | California | 71 | 20 |
| 4 | Hialeah | Florida | 64 | 18 |
| 5 | Stockton | California | 69 | 19 |
| 6 | Pomona | California | 63 | 18 |
| 7 | Newark | New Jersey | 67 | 19 |
| 8 | Philadelphia | Pennsylvania | 68 | 19 |
| 9 | Santa Clarita | California | 76 | 21 |
| 10 | San Bernardino | California | 60 | 17 |
| 11 | Mesquite | Texas | 66 | 18 |
| 12 | Corona | California | 73 | 21 |
| 13 | Los Angeles | California | 64 | 18 |
| 14 | Fontana | California | 64 | 18 |
| 15 | Chicago | Illinois | 70 | 20 |
| 16 | Jersey City | New Jersey | 76 | 21 |
| 17 | Oceanside | California | 64 | 18 |
| 18 | Yonkers | New York | 72 | 20 |
| 19 | Sunrise Manor | Nevada | 58 | 16 |
| 20 | Miami | Florida | 60 | 17 |
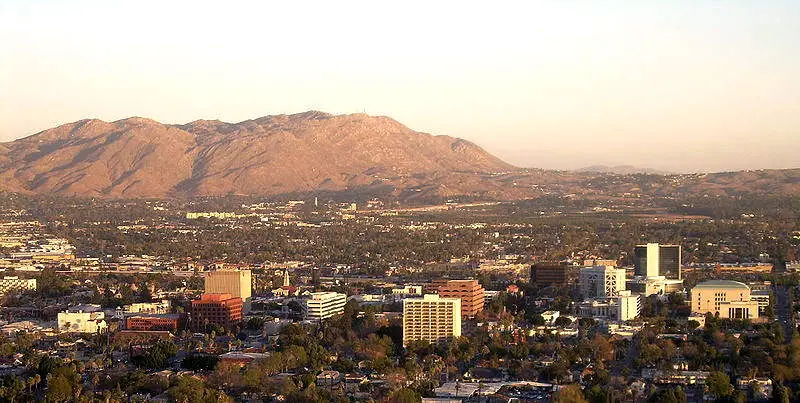
| 21 | Riverside | California | 59 | 17 |
| 22 | Hollywood | Florida | 60 | 17 |
| 23 | Bridgeport | Connecticut | 55 | 15 |
| 24 | Garland | Texas | 59 | 16 |
| 25 | Glendale | Arizona | 59 | 16 |
| 26 | Joliet | Illinois | 63 | 18 |
| 27 | Ontario | California | 59 | 16 |
| 28 | Hayward | California | 72 | 20 |
| 29 | Lancaster | California | 65 | 18 |
| 30 | Garden Grove | California | 59 | 16 |
| 31 | Rancho Cucamonga | California | 68 | 19 |
| 32 | Port St. Lucie | Florida | 59 | 16 |
| 33 | Aurora | Illinois | 58 | 16 |
| 34 | Long Beach | California | 62 | 17 |
| 35 | Detroit | Michigan | 52 | 14 |
| 36 | Aurora | Colorado | 60 | 17 |
| 37 | Baltimore | Maryland | 63 | 18 |
| 38 | Pembroke Pines | Florida | 63 | 18 |
| 39 | Elk Grove | California | 67 | 19 |
| 40 | Murfreesboro | Tennessee | 57 | 16 |
| 41 | Fullerton | California | 61 | 17 |
| 42 | North Las Vegas | Nevada | 59 | 16 |
| 43 | Chula Vista | California | 61 | 17 |
| 44 | Oxnard | California | 54 | 15 |
| 45 | Santa Ana | California | 51 | 14 |
| 46 | Modesto | California | 59 | 16 |
| 47 | Tacoma | Washington | 62 | 17 |
| 48 | Houston | Texas | 55 | 15 |
| 49 | Anaheim | California | 57 | 16 |
| 50 | Oakland | California | 66 | 18 |
Author
Kathy is the head of content at Zippia with a knack for engaging audiences. Prior to joining Zippia, Kathy worked at Gateway Blend growing audiences across diverse brands. She graduated from Troy University with a degree in Social Science Education.


