Find a Job You Really Want In
Ever wondered where in the country people are happiest? Better yet, what cities in your state have the secret sauce for happiness?
Just like where you work and what you do, where you live can have major implications for your quality of life. We set out to find the cities in Illinois where life is sweetest, the wages are high, and people aren’t wasting their lives away in cars,
The results? Happiness comes in small packages.
The result is this list of the best cities for :
- Western Springs, IL
- Deerfield, IL
- Mahomet, IL
- Campton Hills, IL
- Clarendon Hills, IL
- Chatham, IL
- Elmhurst, IL
- Elburn, IL
- Frankfort, IL
- Highland Park, IL
These are the happiest places in Illinois. Keep reading to see what has everyone grinning so much.
How did we determined the happiest places to live in Illinois?
We turned happiness into a science and scoured the state to find the cities with all the ingredients for happiness:
- Being well educated (Population with at least a bachelor’s degree)
- Percent of households earning above $75,000
- Median home prices
- A short commute to work (Traffic = unhappiness)
- Having a family (Getting, and staying married, has a ton of happiness benefits, on average)
We examined over 339 cities, to find the cities that have all of the above in spades.
While some may be confused to see marriage rates included in our metrics, studies show that married people are typically happier than unmarried people. However, it is worth noting that marriage doesn’t cause happiness. In fact, people leaving a bad marriage experience spikes of happiness. However, a happy marriage and positive social interactions are important for mood and mental health.
Similarly, if you’re scratching your head to see $75,000 as the cut-off for happiness, blame Purdue University. Their study found that amount meets basic needs and frees people from the pitfalls of deep financial insecurity that cause unhappiness.
All of our data comes from the most recent American Community Survey.
Keep reading for more on why each of these 10 places is brimming with happiness—or hop to the bottom to see where your city landed on the list.
1. Western Springs
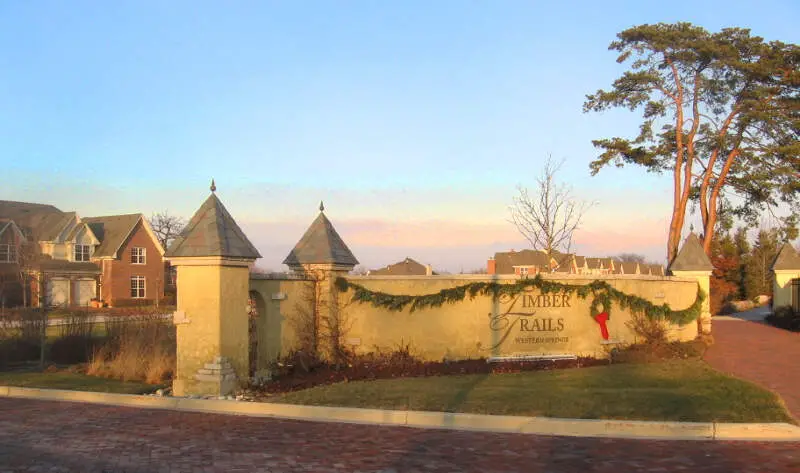
Population: 13,227
Earners Over $75k: 77.6%
Average Commute: 31
Marriage Rate: 47.0%
Western Springs is the happiest city in all of Illinois. What makes Western Springs residents so happy? They aren’t wasting their lives on long commutes for one. The average Western Springs resident only drives 31.5 minuted to work. Toss in affordable housing and the fact that most Western Springs residents are coming home to a loving partner and it’s easy to see the city has a lot going for it.
2. Deerfield
Population: 18,930
Earners Over $75k: 75.9%
Average Commute: 29
Marriage Rate: 38.0%
In 2nd place we have Deerfield. Residents of Deerfield are highly educated, with an impressive 78.0% having at least a bachelor’s degree. And in this modern day, education means options, and folks in Deerfield have plenty of them.
3. Mahomet
Population: 8,327
Earners Over $75k: 72.0%
Average Commute: 20
Marriage Rate: 43.0%
Mahomet is the third happiest city in Illinois. Why so happy? 43.0% of Mahomet residents come home to a partner to share their life burdens. Bonus? Short commutes give them more time to spend with all their loved ones or on hobbies they enjoy.
4. Campton Hills
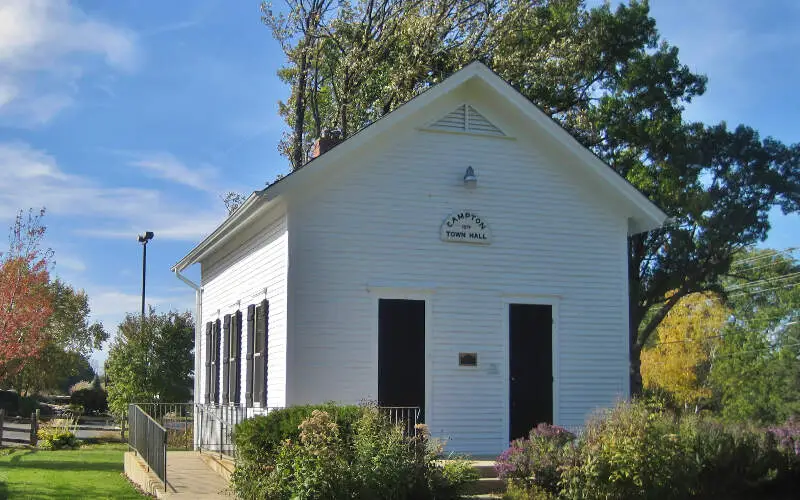
Population: 11,348
Earners Over $75k: 77.0%
Average Commute: 33
Marriage Rate: 44.0%
Folks in Campton Hills have a lot to smile about. An impressive 77.0% of Campton Hills households earn $75,000 or more. That means families in Campton Hills can afford peace of mind.
5. Clarendon Hills
Population: 8,711
Earners Over $75k: 65.6%
Average Commute: 31
Marriage Rate: 37.0%
Clarendon Hills is the 5th happiest city in the whole state. Clarendon Hills residents’ moods are kept high by reasonable home prices (the median home price in this Illinois city is only $561,700), happy marriages, and short commutes.
6. Chatham
Population: 12,535
Earners Over $75k: 60.6%
Average Commute: 21
Marriage Rate: 45.0%
Looking to relocate? Data says you should give Chatham a second look because it has all the ingredients for happiness. A staggering 60.6% of households earn over 75,000. Toss in high marriage rates and reasonable commutes, and it’s easy to see those who call Chatham home have a lot to be happy about.
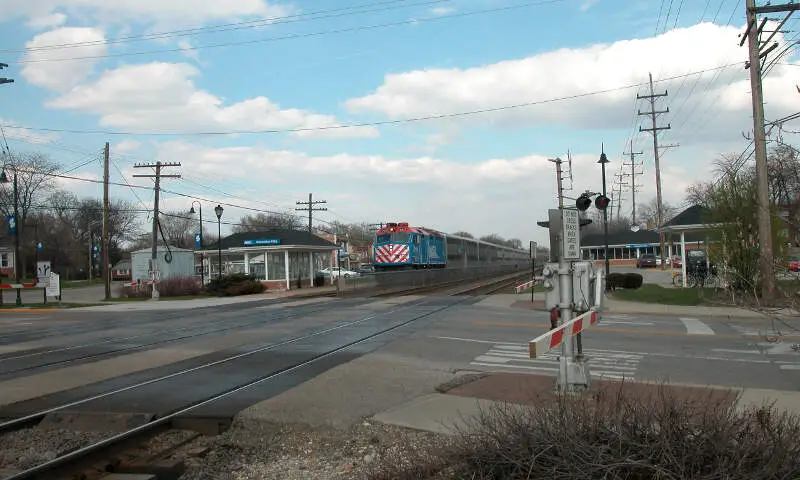
7. Elmhurst
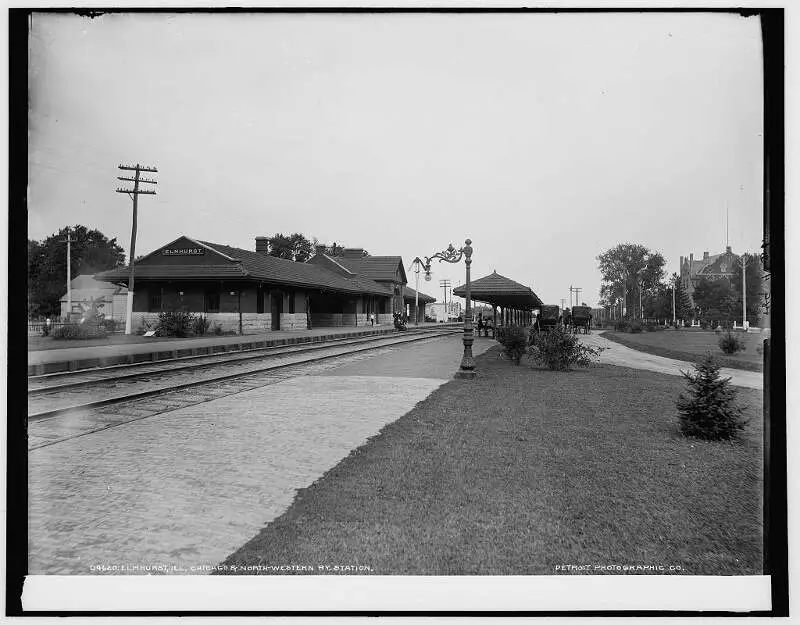
Population: 46,331
Earners Over $75k: 66.3%
Average Commute: 29
Marriage Rate: 35.0%
Elmhurst is the 7th happiest city. Elmhurst residents pull in respectable salaries and manage to do it, on average, within 29.9 minutes of their home. They can use all that extra time saved from a long commute to indulge in hobbies they’re passionate about.
8. Elburn
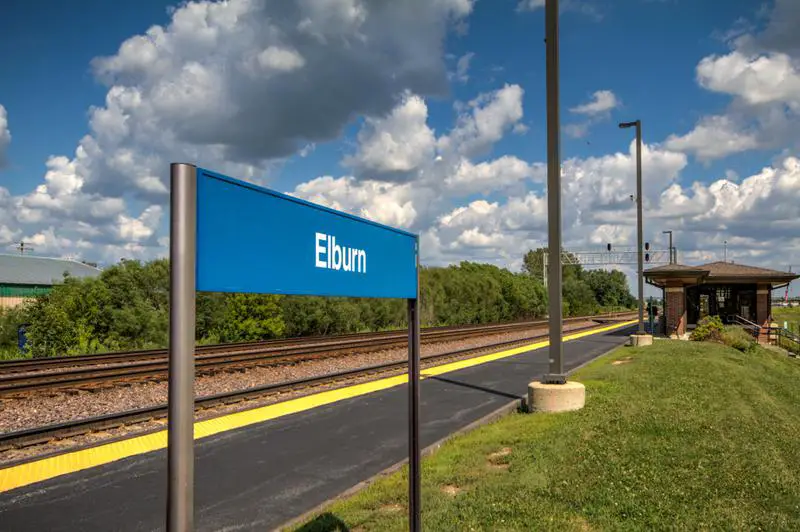
Population: 5,823
Earners Over $75k: 70.9%
Average Commute: 30
Marriage Rate: 38.0%
Elburn residents are highly educated with good incomes, decent marriage rates, and reasonable commutes. What’s not to be happy about?
9. Frankfort
Population: 18,850
Earners Over $75k: 74.0%
Average Commute: 36
Marriage Rate: 46.0%
The 9th happiest city in all of Illinois is Frankfort. The average commute in Frankfort is only 36.2 minutes. That means they are only 36.2 minutes away from the loving spouse 46.0% of them have.
10. Highland Park
Population: 29,731
Earners Over $75k: 71.8%
Average Commute: 30
Marriage Rate: 35.0%
In 10th place is Highland Park, Illinois. What makes Highland Park so great? Affordable housing, reasonable commutes, and healthy incomes. If happiness is contagious, moving here might be worth a try.
And that’s our list of the happiest cities in Illinois
There you have it, happiness is a place.
While we can’t guarantee everyone living and working in the top 10 cities is happy, they have a better chance the most.
If you are looking to improve your own happiness, check out how you can help improve your personal factors: housing costs, job satisfaction, income, and education.
If your city didn’t make the top 10, check out the list below to see whether it missed the cut by a hair or if folks there are struggling to escape despair.
Detailed List Of The Happiest Cities In
| Rank | City | High Earners |
|---|---|---|
| 1 | Western Springs | 77.6% |
| 2 | Deerfield | 75.9% |
| 3 | Mahomet | 72.0% |
| 4 | Campton Hills | 77.0% |
| 5 | Clarendon Hills | 65.6% |
| 6 | Chatham | 60.6% |
| 7 | Elmhurst | 66.3% |
| 8 | Elburn | 70.9% |
| 9 | Frankfort | 74.0% |
| 10 | Highland Park | 71.8% |
| 11 | Libertyville | 70.2% |
| 12 | Lake Bluff | 81.3% |
| 13 | Batavia | 60.5% |
| 14 | Hampshire | 65.8% |
| 15 | Hinsdale | 76.7% |
| 16 | Riverside | 66.7% |
| 17 | Plainfield | 75.3% |
| 18 | Glencoe | 80.4% |
| 19 | La Grange | 65.8% |
| 20 | Geneva | 64.7% |
| 21 | Winnetka | 78.6% |
| 22 | La Grange Park | 61.9% |
| 23 | New Lenox | 68.0% |
| 24 | Long Grove | 85.4% |
| 25 | Mokena | 69.0% |
| 26 | Wilmette | 74.2% |
| 27 | Shorewood | 66.4% |
| 28 | Oswego | 70.0% |
| 29 | Washington | 48.3% |
| 30 | Hawthorn Woods | 78.0% |
| 31 | Lake Zurich | 71.9% |
| 32 | Park Ridge | 64.5% |
| 33 | River Forest | 70.7% |
| 34 | Glenview | 65.8% |
| 35 | Inverness | 78.8% |
| 36 | Johnsburg | 75.9% |
| 37 | Glen Ellyn | 62.6% |
| 38 | Roscoe | 58.3% |
| 39 | Columbia | 59.2% |
| 40 | Sugar Grove | 77.3% |
| 41 | Pingree Grove | 61.8% |
| 42 | Barrington | 64.9% |
| 43 | Northfield | 65.6% |
| 44 | Channahon | 64.2% |
| 45 | Frankfort Square | 68.6% |
| 46 | Cary | 64.3% |
| 47 | Northbrook | 68.7% |
| 48 | Manhattan | 60.9% |
| 49 | South Elgin | 65.3% |
| 50 | Wheaton | 61.3% |
| 51 | Morton | 52.4% |
| 52 | Lake Villa | 61.9% |
| 53 | Buffalo Grove | 68.5% |
| 54 | Naperville | 69.5% |
| 55 | Spring Grove | 79.9% |
| 56 | Lemont | 64.4% |
| 57 | Lindenhurst | 69.1% |
| 58 | Gilberts | 69.6% |
| 59 | Bartlett | 66.5% |
| 60 | Brookfield | 55.3% |
| 61 | Algonquin | 65.8% |
| 62 | Vernon Hills | 59.8% |
| 63 | Lake Forest | 73.8% |
| 64 | Yorkville | 65.1% |
| 65 | Glen Carbon | 54.6% |
| 66 | Gurnee | 59.0% |
| 67 | Burr Ridge | 72.3% |
| 68 | Minooka | 55.8% |
| 69 | St. Charles | 59.2% |
| 70 | Winfield | 67.5% |
| 71 | Downers Grove | 57.0% |
| 72 | Oak Brook | 74.7% |
| 73 | Homer Glen | 64.5% |
| 74 | Lincolnshire | 66.5% |
| 75 | O’fallon | 57.3% |
| 76 | Grandwood Park | 68.2% |
| 77 | Mount Zion | 50.7% |
| 78 | Lockport | 53.7% |
| 79 | Lake In The Hills | 60.8% |
| 80 | North Aurora | 54.1% |
| 81 | Arlington Heights | 58.4% |
| 82 | Crystal Lake | 58.7% |
| 83 | Troy | 48.6% |
| 84 | Gages Lake | 62.9% |
| 85 | West Dundee | 55.6% |
| 86 | Mundelein | 60.6% |
| 87 | Monticello | 47.8% |
| 88 | Hoffman Estates | 59.2% |
| 89 | Carterville | 32.1% |
| 90 | Itasca | 60.0% |
| 91 | Montgomery | 56.2% |
| 92 | Grayslake | 60.7% |
| 93 | Carol Stream | 53.8% |
| 94 | Morris | 40.4% |
| 95 | Warrenville | 53.7% |
| 96 | Flossmoor | 70.8% |
| 97 | Mascoutah | 51.6% |
| 98 | Mount Prospect | 49.3% |
| 99 | Antioch | 56.1% |
| 100 | Sycamore | 46.6% |
Author
Kathy is the head of content at Zippia with a knack for engaging audiences. Prior to joining Zippia, Kathy worked at Gateway Blend growing audiences across diverse brands. She graduated from Troy University with a degree in Social Science Education.


