- Industry Statistics
- Wedding Industry Statistics
- Yoga Industry Statistics
- Music Industry Statistics
- Landscaping Industry Statistics
- Bicycle Industry Statistics
- Coffee Industry Statistics
- Car Rental Industry Statistics
- Home Improvement Industry Statistics
- Insurance Industry Statistics
- Supplements Industry Statistics
- Golf Industry Statistics
- Fitness Industry Statistics
- US Media And Entertainment Industry Statistics
- Firearm Industry Statistics
- Financial Services Industry Statistics
- Health And Wellness Industry Statistics
- Trucking Industry Statistics
- Wine Industry Statistics
- Pet Industry Statistics
- Mobile App Industry Statistics
- Digital Marketing Industry Statistics
- Hotel Industry Statistics
- Retail Statistics
- Robotics Industry Statistics
- Jewelry Industry Statistics
- Appointment Scheduling statistics
- Restaurant Industry Statistics
- Food Delivery Statistics
- Food Truck Industry
- Fashion Industry
- Real Estate Industry
- US Film Industry
- US Beverage Industry
- USu202fFast Food Restaurants
- US Construction Industry
- US Book Industry
- Cosmetics Industry
- US Food Retail Industry
- US Pharmaceutical Industry
- US Healthcare Industry
- Airline Industry
- Automobile Industry
- Transportation Industry Statistics
- Event Industry Statistics
- Project Management Statistics
- Oil And Gas Industry Statistics
- Nursing Home Statistics
- Nursing Shortage Statistics
- Nursing Statistics
20+ Dazzling Jewelry Industry Statistics [2026]: Facts, Data, Trends and More
Research Summary. Jewelry plays an essential role in American culture and the economy, highlighting moments from engagements to anniversaries and personal expression. The oldest jewelry store in the United States has been operating since 1785, showcasing a long-standing tradition in the industry.
To better understand the current state of the U.S. jewelry market, we present key statistics that reflect the industry’s dynamics:
-
The U.S. jewelry market generated $60.42 billion in annual revenue in 2023.
-
The global jewelry industry is valued at $298.40 billion as of 2023.
-
The U.S. jewelry market is projected to grow at a CAGR of 0.78% from 2021 to 2026, reaching $61.87 billion in revenue by 2026.
-
Online jewelry sales amounted to nearly $7.6 billion in 2021 in the U.S.
-
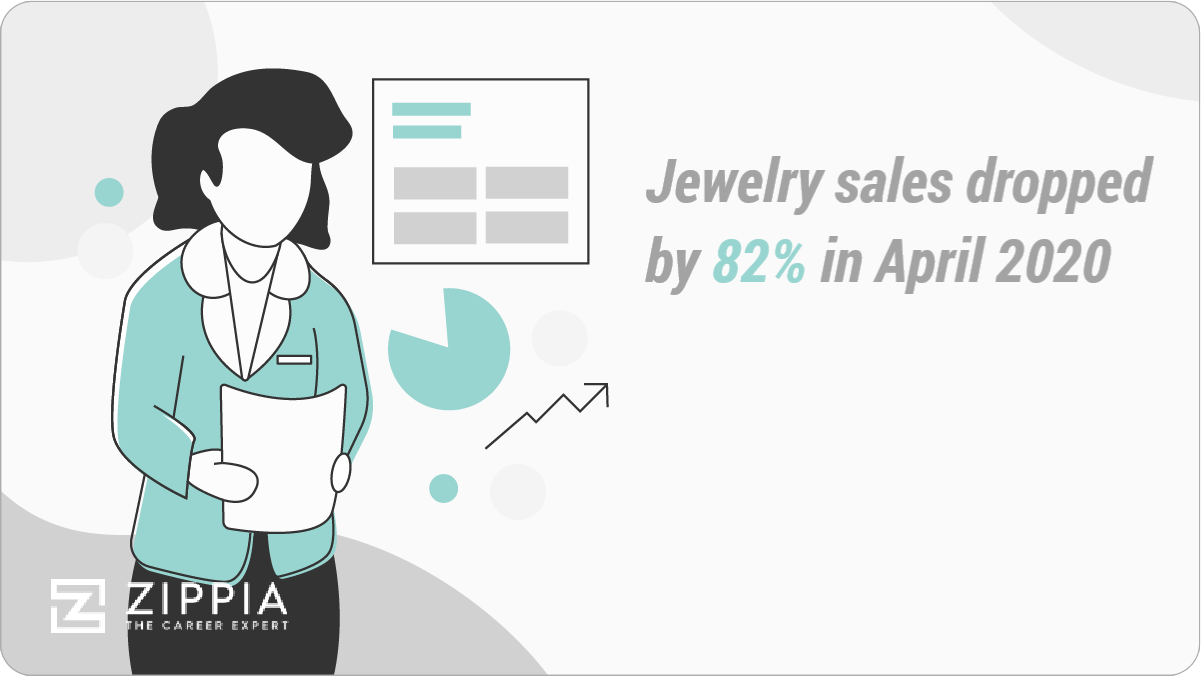
Jewelry sales experienced a significant downturn in early 2020, dropping by 82%.
-
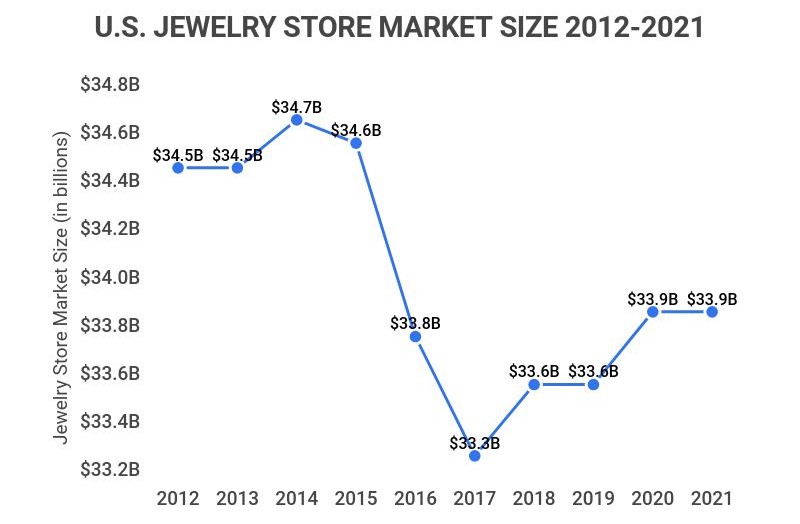
The U.S. jewelry store market size is $33.9 billion as of 2021.
For further analysis, we broke down the data in the following ways:
Consumer Preferences | Online Jewelry Market | Effects of the Pandemic on Jewelry Sales
General Jewelry Industry Statistics
-
As of 2023, there are 45,792 jewelry store businesses in the U.S.
California leads with 6,594 stores, followed by New York with 5,522, and Florida with 4,748.
The number of jewelry store businesses in the U.S. declined by 3.3% from 2018 to 2023 and fell by 2.1% from 2022 to 2023 alone.
-
The market size of U.S. jewelry stores is $33.9 billion.
This number grew by 0.1% in 2021, reflecting a slower annualized growth compared to the overall U.S. economy.
-
The U.S. jewelry manufacturing industry employs 24,378 people, while 136,828 work in jewelry retail.
This totals 161,206 employees; however, both sectors saw an employment decrease of just over 5% annually from 2018 to 2023.
-
LVMH is the world’s largest jewelry retailer.
The luxury goods conglomerate, including brands such as Bulgari, Hublot, De Beers, and TAG Heuer, generates 24% of its $52.9 billion annual revenue from the U.S.
-
Signet Jewelers Limited is the largest specialty jewelry retailer in the U.S.
The company, which owns Jared, Zales, and Kay Jewelers, reported $6.25 billion in revenue in 2019 and operates over 3,000 stores globally.
Tiffany and Co. follows with $4.4 billion in revenue but has only 321 stores.
-
Approximately 12% of the global jewelry market is controlled by the ten largest jewelry groups.
Most purchases occur at local businesses rather than large retailers. Furthermore, only 20% of the market comprises branded jewelry, a figure expected to rise significantly in the coming years.
Jewelry Industry Statistics by Consumers
-
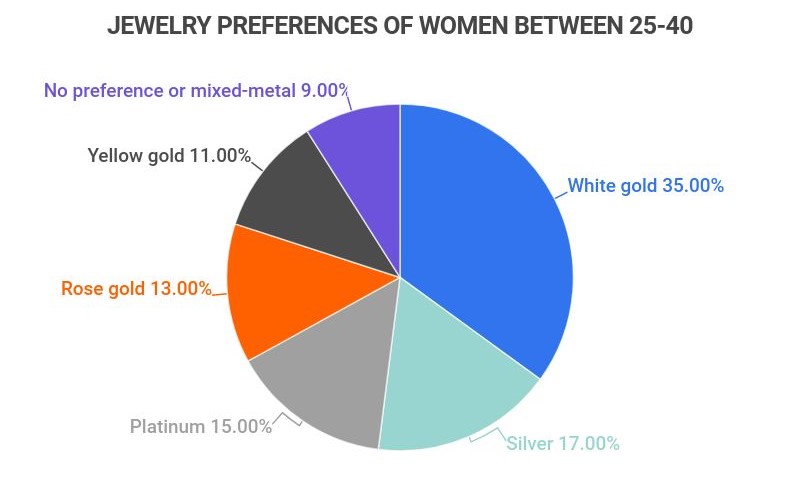
35% of surveyed women prefer white gold for their jewelry.
17% prefer silver, 15% choose platinum, 13% like rose gold, and only 11% favor yellow gold. The remaining 9% showed no preference or opted for mixed-metal pieces.
These respondents are primarily aged between 25 and 40.
-
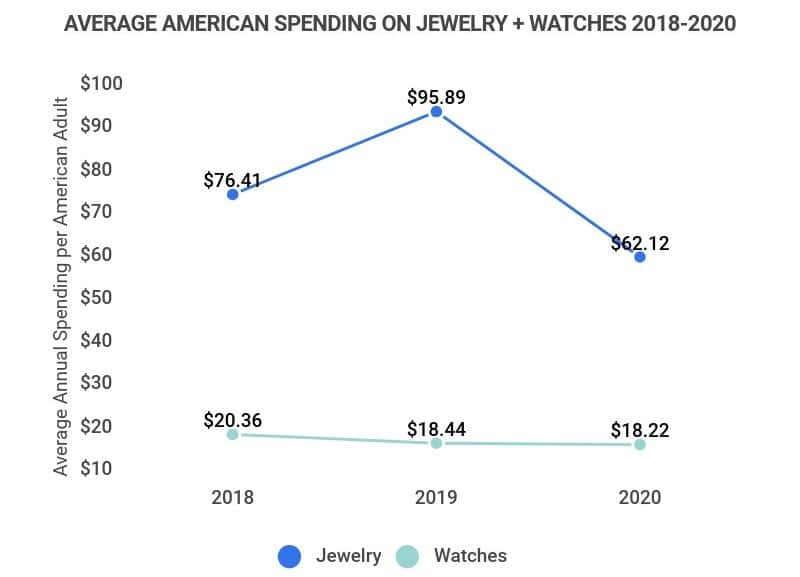
The average American spent $62.12 on jewelry in 2020.
This reflects a decrease from $95.89 in 2019 and $76.41 in 2018, excluding watches, for which Americans spent an average of $18.22 in 2020.
The average spent on watches remained relatively stable, with Americans spending $20.36 in 2018 and $18.44 in 2019.
-
Jewelry companies experienced a 38% increase in custom jewelry sales from 2019 to 2020.
This surge is attributed to millennials’ emphasis on individuality and the influence of social media, which presents more personalized options than traditional jewelry stores.
-
The U.S. accounts for 48% of global polished diamond demand.
This figure has increased from 42% in 2014, demonstrating the U.S.’s significant role in the global diamond market.
Online Jewelry Industry Statistics
-
Online jewelry sales represent approximately 5-10% of total jewelry sales.
The online sales growth rate averaged 14% from 2017 to 2018, with continued expansion expected.
-
Online jewelry sales grew at an annual average rate of 3.9% from 2012 to 2021.
The most significant increase occurred in 2015, with a 17.2% rise from $5.8 billion in sales in 2014 to $6.8 billion in 2015.
Online sales dipped by 9.7% from 2019 to 2020 but stabilized in 2021.
-
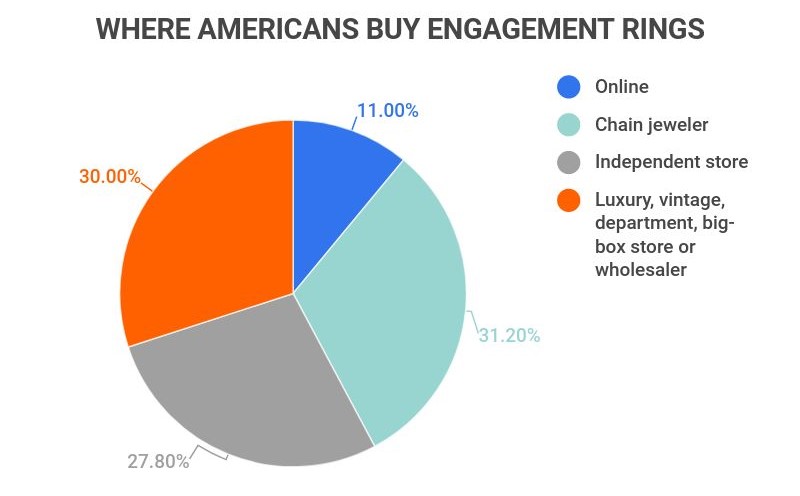
11% of recent engagement ring purchases were made online.
Online retailers ranked last in popularity for engagement ring purchases, trailing chain jewelers at 31.2% and independent stores at 27.8%. Various other sources accounted for the remaining 30% of purchases.

Effects of the Pandemic on Jewelry Sales
-
The jewelry industry saw an 82% drop in sales at the onset of the COVID-19 pandemic.
This decline was primarily due to income loss, event cancellations, and postponed engagements.
-
During June, July, and August 2020, fine jewelry sales rose by $1 billion compared to the same months in 2019.
As lockdowns eased, consumers redirected funds typically reserved for travel and large events toward jewelry purchases, leading to significant sales boosts in these months.
However, luxury jewelry sales were slower to recover due to fewer trunk shows and formal events.
-
Engagement ring sales increased by 20-30% for some retailers during the pandemic.
Many retailers reported that bridal-related sales surpassed general sales, with customers frequently buying both engagement rings and wedding bands in one visit.
Jewelry Industry Statistics FAQ
-
Is the jewelry industry dying?
No, the jewelry industry isn’t dying. It is evolving.
Brick-and-mortar stores are facing challenges, evidenced by a 4-5% drop in jewelry stores from 2017 to 2018. This decline is slower than that of other retail sectors, such as florists and bookstores.
As consumer habits shift, jewelry sales increasingly transition online, whether through established retailers, new online-only platforms, or independent vendors on marketplaces like Etsy.
-
Individuals aged 45 to 54, particularly those in large cities with annual incomes over $200,000, are the top jewelry consumers.
This demographic typically has advanced degrees and high-level positions, making them less susceptible to financial instability during economic downturns.
While millennials aged 25 to 34 were previously the largest buyers, their spending decreased in 2020 due to postponed weddings and social gatherings.
-
Is the jewelry industry part of the fashion industry?
No, the jewelry industry stands alone, particularly in fine jewelry. However, it shares close ties with the fashion industry.
Trends in both sectors are influenced by designers, celebrities, and social media personalities, with costume jewelry often considered part of fashion while fine jewelry remains distinct.
-
How much is the jewelry industry worth?
The global jewelry industry is valued at $298.40 billion. In the U.S., the jewelry and watch market is approximately $60.4 billion. Despite pandemic-related revenue dips, the industry is on the rebound, adapting to a changing landscape.
-
What is the future of the jewelry industry?
The jewelry industry’s outlook is positive, with expectations of reaching a market value of $292 billion by 2025, up from around $249.02 billion today. Growth is anticipated in online sales and branded jewelry segments.
Trends such as influencer marketing, personalized jewelry, and social media-driven advertising are expected to shape the future of consumer engagement in the jewelry market.
Conclusion
The U.S. jewelry industry is undergoing a pivotal transformation, shifting away from traditional brick-and-mortar stores as consumers increasingly opt for online purchasing. In 2020, 11% of engagement ring sales occurred online, a trend that continues to rise.
Millennials are playing a significant role in this shift, favoring online shopping and contributing to an uptick in bridal and engagement jewelry purchases as they navigate post-pandemic life.
Preferences among female shoppers indicate a strong inclination towards white gold (35%), alongside a notable 38% growth in demand for custom jewelry, reflecting consumers’ desires for unique and personalized pieces.
The U.S. remains a critical player in the global jewelry market, accounting for 48% of the demand for polished diamonds and contributing $33.9 billion to the overall $298.40 billion market value.
References
-
IBISWorld. “The Top Ten Jewellery Companies in the World.” Accessed on December 2, 2021.
-
Statista. “Revenue Share of the LVMH Group Worldwide in 2020, by Geographic Region.” Accessed on December 2, 2021.
-
Statista. “Jewelry Store Sales in the United States From 1992 to 2019.” Accessed on December 2, 2021.
-
McKinsey. “A Multifaceted Future: The Jewelry Industry in 2020.” Accessed on December 2, 2021.
-
National Jeweler. “Study: 51 Percent of Millennial Women Buy Jewelry for Themselves.” Accessed on December 2, 2021.
-
Statista. “Average Annual Expenditure on Jewelry and Valuables Per Consumer Unit in the United States From 2018 to 2020, by Category.” Accessed on December 2, 2021.
-
Instore. “JCK Releases the 2020 State of the Jewelry Industry Report: COVID-19 Business Impact.” Accessed on December 2, 2021.
-
Statista. “Distribution of Polished Diamond Demand Worldwide From 2014 to 2019, by Region.” Accessed on December 2, 2021.
-
The Clearsale Blog. “Jewelry E-Commerce Statistics and Insights.” Accessed on December 2, 2021.
-
Sales Layer. “The Success of eCommerce in the Jewelry Industry.” Accessed on December 2, 2021.”
-
Oberlo. “Online Jewelry Sales Statistics (2011-2021).” Accessed on December 2, 2021.
-
Ringspo. “Ringspo 2021 Engagement Ring Survey.” Accessed on December 2, 2021.
-
The Jerusalem Post. “How COVID-19 Has Impacted the Jewelry Industry and How Businesses Can Adapt.” Accessed on December 2, 2021.
-
The New York Times. “Even in a Pandemic, Fine Jewelry is Selling.” Accessed on December 2, 2021.
-
Brides. “5 Ways Engagement Ring Shopping Has Changed Since COVID-19.” Accessed on December 2, 2021.
-
Jewelers of America. “Jewelry Industry Is Shrinking, Or Is It?” Accessed on December 2, 2021.
-
Edahn Golan. “Spending on Jewelry: Almost All Spent More.” Accessed on December 2, 2021.
-
NAICS Association. “Industry: 5944—Jewelry Stores.” Accessed on December 2, 2021.
-
Statista. “Jewelry: United States.” Accessed on March 2, 2023.
-
Statista. “Jewelry: Worldwide.” Accessed on March 2, 2023.
-
IBISWorld. “Jewelry Stores in the U.S. – Number of Businesses 2005-2027.” Accessed on March 2, 2023.
-
IBISWorld. “Jewelry Stores in the U.S. – Market Size 2005-2027.” Accessed on March 2, 2023.
-
IBISWorld. “Jewelry Manufacturing in the U.S. – Employment Statistics 2005-2027.” Accessed on March 2, 2023.
-
IBISWorld. “Jewelry Stores in the U.S. – Employment Statistics 2005-2027.” Accessed on March 2, 2023.
- Industry Statistics
- Wedding Industry Statistics
- Yoga Industry Statistics
- Music Industry Statistics
- Landscaping Industry Statistics
- Bicycle Industry Statistics
- Coffee Industry Statistics
- Car Rental Industry Statistics
- Home Improvement Industry Statistics
- Insurance Industry Statistics
- Supplements Industry Statistics
- Golf Industry Statistics
- Fitness Industry Statistics
- US Media And Entertainment Industry Statistics
- Firearm Industry Statistics
- Financial Services Industry Statistics
- Health And Wellness Industry Statistics
- Trucking Industry Statistics
- Wine Industry Statistics
- Pet Industry Statistics
- Mobile App Industry Statistics
- Digital Marketing Industry Statistics
- Hotel Industry Statistics
- Retail Statistics
- Robotics Industry Statistics
- Jewelry Industry Statistics
- Appointment Scheduling statistics
- Restaurant Industry Statistics
- Food Delivery Statistics
- Food Truck Industry
- Fashion Industry
- Real Estate Industry
- US Film Industry
- US Beverage Industry
- USu202fFast Food Restaurants
- US Construction Industry
- US Book Industry
- Cosmetics Industry
- US Food Retail Industry
- US Pharmaceutical Industry
- US Healthcare Industry
- Airline Industry
- Automobile Industry
- Transportation Industry Statistics
- Event Industry Statistics
- Project Management Statistics
- Oil And Gas Industry Statistics
- Nursing Home Statistics
- Nursing Shortage Statistics
- Nursing Statistics
Author
Abby is a writer who is passionate about the power of story. Whether it’s communicating complicated topics in a clear way or helping readers connect with another person or place from the comfort of their couch. Abby attended Oral Roberts University in Tulsa, Oklahoma, where she earned a degree in writing with concentrations in journalism and business.