- Industry Statistics
- Wedding Industry Statistics
- Yoga Industry Statistics
- Music Industry Statistics
- Landscaping Industry Statistics
- Bicycle Industry Statistics
- Coffee Industry Statistics
- Car Rental Industry Statistics
- Home Improvement Industry Statistics
- Insurance Industry Statistics
- Supplements Industry Statistics
- Golf Industry Statistics
- Fitness Industry Statistics
- US Media And Entertainment Industry Statistics
- Firearm Industry Statistics
- Financial Services Industry Statistics
- Health And Wellness Industry Statistics
- Trucking Industry Statistics
- Wine Industry Statistics
- Pet Industry Statistics
- Mobile App Industry Statistics
- Digital Marketing Industry Statistics
- Hotel Industry Statistics
- Retail Statistics
- Robotics Industry Statistics
- Jewelry Industry Statistics
- Appointment Scheduling statistics
- Restaurant Industry Statistics
- Food Delivery Statistics
- Food Truck Industry
- Fashion Industry
- Real Estate Industry
- US Film Industry
- US Beverage Industry
- USu202fFast Food Restaurants
- US Construction Industry
- US Book Industry
- Cosmetics Industry
- US Food Retail Industry
- US Pharmaceutical Industry
- US Healthcare Industry
- Airline Industry
- Automobile Industry
- Transportation Industry Statistics
- Event Industry Statistics
- Project Management Statistics
- Oil And Gas Industry Statistics
- Nursing Home Statistics
- Nursing Shortage Statistics
- Nursing Statistics
25 Insightful Nursing Home Statistics [2026]: How Many Nursing Homes Are In the US?
Research Summary. With the aging of the Baby Boomer generation, the demand for nursing homes and residential care facilities has surged. Here are some key statistics on nursing homes in the U.S. as of 2026:
-
Approximately 1.4 million residents currently reside in U.S. nursing homes.
-
The U.S. has about 26,514 nursing homes.
-
By the age of 65, 70% of individuals will require long-term care at some point in their lives.
-
By 2050, an estimated 30 million individuals in the Americas will need long-term care services.
For more detailed analysis, we have categorized the data as follows:
Population | Trends and Projections | Industry | Demographics
Long-Term Care Statistics by Nursing Home Population
-
Over 810,000 individuals reside in assisted living facilities across the United States.
-
4% of U.S. seniors are found in nursing homes.
-
2% of U.S. seniors live in assisted living facilities.
-
52% of the assisted living population is over the age of 85.
-
65% of individuals utilize in-home care services.
-
California leads the nation with 99,956 nursing home residents.
Number of Nursing Home Residents By State
| State | Nursing Home Residents |
|---|---|
| California | 99,956 |
| Texas | 90,708 |
| New York | 89,775 |
| Pennsylvania | 72,519 |
| Ohio | 71,852 |
| Florida | 71,162 |
| Illinois | 65,607 |
| New Jersey | 42,413 |
| Indiana | 37,564 |
| Michigan | 37,547 |
| Missouri | 37,277 |
| North Carolina | 36,148 |
| Massachusetts | 34,363 |
| Tennessee | 26,647 |
| Louisiana | 25,863 |
| Minnesota | 23,444 |
| Georgia | 22,894 |
| Alabama | 22,684 |
| Iowa | 22,349 |
| Kentucky | 21,482 |
| Wisconsin | 21,236 |
| Connecticut | 19,624 |
| Virginia | 19,550 |
| Arkansas | 17,285 |
| Oklahoma | 17,213 |
| Kansas | 16,812 |
| State | Nursing Home Residents |
|---|---|
| Maryland | 16,464 |
| Colorado | 16,004 |
| Mississippi | 15,923 |
| South Carolina | 15,563 |
| Washington | 15,094 |
| Nebraska | 10,584 |
| Arizona | 10,325 |
| West Virginia | 9,278 |
| Rhode Island | 7,558 |
| New Hampshire | 6,397 |
| Maine | 5,846 |
| Nevada | 5,626 |
| South Dakota | 5,585 |
| Utah | 5,574 |
| New Mexico | 5,510 |
| North Dakota | 5,321 |
| Oregon | 4,672 |
| Delaware | 3,937 |
| Montana | 3,776 |
| Hawaii | 3,444 |
| Idaho | 3,286 |
| Vermont | 2,359 |
| Wyoming | 2,224 |
| District of Columbia | 1,256 |
| Alaska | 499 |
Long-Term Care Trends and Projections
-
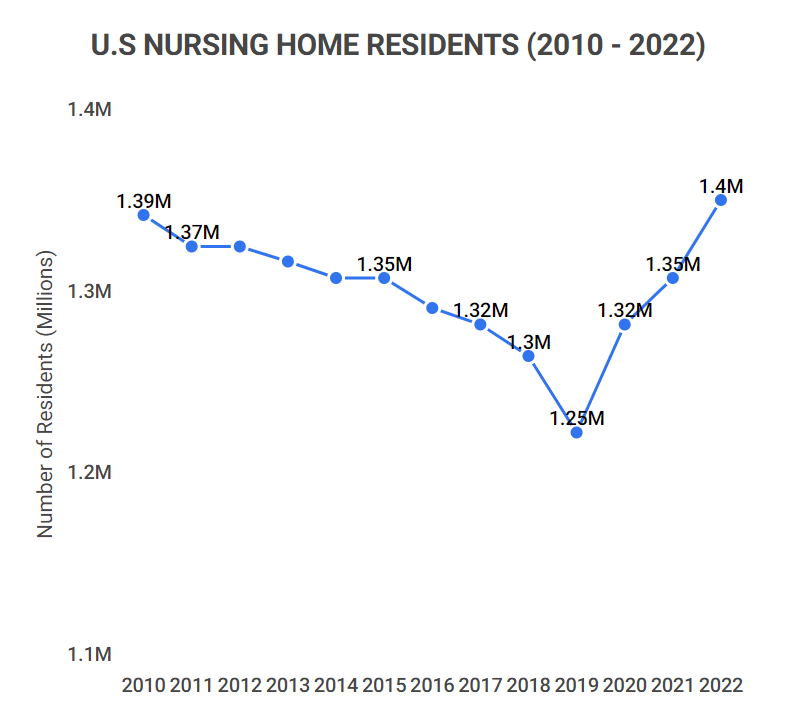
The number of nursing home residents has stabilized at 1.4 million in 2026, showing resilience after fluctuations in previous years.
Here is the annual count of U.S. nursing home residents from 2010 to 2026:
Number of Nursing Home Residents By Year
Year Number of Nursing Home Residents 2026 1.40 million 2025 1.350 million 2024 1.290 million 2023 1.246 million 2022 1.30 million 2021 1.322 million 2020 1.329 million 2019 1.352 million 2018 1.348 million 2017 1.360 million 2016 1.367 million 2015 1.370 million 2014 1.385 million -
There are approximately 53 million unpaid family caregivers in the U.S.
It’s estimated that 21.3% of Americans have provided care to a child with special needs or an adult in the past year, with 26% caring for someone with Alzheimer’s or dementia.
-
By 2050, an estimated 27 million to 30 million individuals in the Americas will require long-term care services.
This projection focuses solely on adults over the age of 60, highlighting a dramatic increase from previous years.
-
As of 2026, there are 26,514 nursing care facilities (nursing homes) in the U.S.
This represents a 2% increase from 2025, maintaining a consistent growth trajectory of about 2% annually since 2017. The number of nursing homes is expected to grow by 2.2% in 2026.

Nursing Home Statistics by the Nursing Home Industry
-
The U.S. nursing home industry is valued at $146.9 billion in 2026.
In 2025, its market size was $140.6 billion, showing steady growth over the years.
The U.S. nursing home market has experienced an average annual growth rate of 1.9% from 2017 to 2026, with projections suggesting continued growth.
-
Approximately 69.3% of nursing homes are for-profit organizations.
23.5% are nonprofit organizations, while 7.2% are government-run facilities.
In contrast, 81% of residential care communities are for-profit, with 17.7% being nonprofits.
-
The average monthly cost of a semi-private room in a nursing home in the U.S. is $7,756.
The monthly cost for a private nursing home room averages $8,821.
Alaska has the highest costs, averaging $36,378 for a private room and $37,143 for a semi-private room. Missouri offers the lowest rates at $5,749 for a private room and $5,080 for a semi-private room.
-
In 2026, there are 1,721,732 nursing home employees in the U.S.
Following a decline from 2012 to 2020, the workforce is now increasing, with an average annual growth rate of 0.6% from 2017 to 2026. In 2026, the workforce is expected to grow by 3.2%.
-
The average U.S. nursing home has 108.6 beds.
New York has the highest average number of beds per nursing home at 186.3, while Alaska has the fewest at 41.4 beds.
Long-Term Care Statistics by Nursing Home Demographics
-
54.6% of nursing home residents are women.
This results in just 35.4% of residents being men, a trend mirrored in assisted living facilities where 70.6% are women.
-
47.8% of nursing home residents have Alzheimer’s disease or other dementias.
This is the second most common condition, with hypertension affecting 71.5% of residents.
-
23% of assisted living facilities provide dementia care units.
14.3% have dedicated sections for dementia care, while 8.7% focus exclusively on serving individuals with dementia.
-
The majority of nursing home residents are non-Hispanic white.
Here’s the breakdown by race:
Demographics Of Nursing Home Residents
Race Share of Nursing Home Residents Share of Assisted Living Residents Non-Hispanic white 75.1% 81.4% Non-Hispanic Black 14.3% 4.1% Hispanic 5.4% 3.1% Non-Hispanic other 5.1% 11.5% -
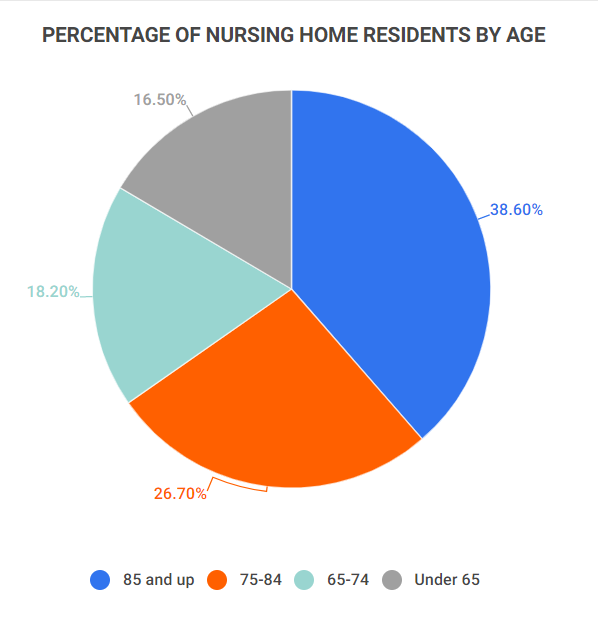
Individuals aged 85 and older represent the largest share of nursing home residents.
Here’s the age distribution of nursing home residents:
Age of Nursing Home Residents
Age Group Share of Nursing Home Residents 85 and up 38.6% 75-84 26.7% 65-74 18.2% Under 65 16.5%
Nursing Home Statistics FAQ
-
How many Americans live in nursing homes?
Approximately 1.4 million Americans reside in nursing homes. Additionally, there are more than 810,000 individuals living in assisted living facilities.
Assisted living facilities offer less intensive care than nursing homes and cater to those who can live independently but need some assistance. Many residents transition to nursing homes within a couple of years.
California has the highest number of nursing home residents at about 99,956. Texas and New York follow closely with 90,708 and 89,775 residents, respectively, while Alaska has the fewest at 499.
-
How many nursing homes are there in the U.S.?
There are about 26,514 nursing homes in the U.S. This figure reflects a 2% increase from 2025 and aligns with the average annual growth rate of 2% from 2017 to 2026.
This growth trend is expected to continue, with a projected increase of 2.2% in 2026.
Nearly 70% of these nursing homes are for-profit organizations, with 23.5% being nonprofit and 7.2% government-operated.
-
What is the average lifespan in a nursing home?
The average lifespan in a nursing home is approximately 2.2 years. This duration varies significantly by individual circumstances.
Women typically require long-term care for a longer duration than men, averaging 3.7 years compared to 2.2 years for men.
Moreover, 20% of individuals currently aged 65 will need some form of long-term care for more than five years, while about 33% may never require long-term care.
-
What percentage of Americans over 65 live in nursing homes?
4% of Americans over 65 reside in nursing homes. Additionally, 2% of this demographic live in assisted living facilities.
Among those in nursing homes, 18.2% are aged 65-74, 26.7% are aged 75-84, and 38.6% are 85 or older.
There is also a notable proportion of residents under 65, accounting for 16.5% of all nursing home residents.
-
How big is the U.S. nursing home industry?
The U.S. nursing home industry is valued at $146.9 billion. In the previous year, its market size was $140.6 billion, reflecting a steady growth trend.
The industry consists of 26,514 nursing homes, and this number is anticipated to rise by 2.2% in 2026.
Approximately 1.7 million individuals are employed within these facilities, with employment numbers showing an upward trend since 2020, expected to increase by 3.2% in 2026 alone.
Conclusion
In 2026, around 1.4 million individuals live in nursing homes, with an additional 810,000 in assisted living facilities. Projections indicate that by 2050, the demand for nursing homes and assisted living will more than triple, highlighting an urgent need for expansion in these facilities.
The nursing home industry is already experiencing significant growth, with a projected 4.5% increase in market size in 2026 and a consistent growth in the number of nursing home facilities.
References
-
Consumer Affairs. “2021 Assisted Living Statistics.” Accessed on May 10, 2022.
-
Administration for Community Living. “How Much Care Will You Need?” Accessed on May 10, 2022.
-
Statista. “Number of Residents in Certified Nursing Facilities in the United States as of 2019, by State.” Accessed on May 10, 2022.
-
KFF. “Total Number of Residents in Certified Nursing Facilities.” Accessed on May 10, 2022.
-
AARP. “Caregiving in the United States 2020.” Accessed on May 10, 2022.
-
Pan American Health Organization. “Number of Older Adults with Long-Term Care Needs Will Triple by 2050, PAHO Warns.” Accessed on May 20, 2022.
-
IBISWorld. “Nursing Care Facilities in the U.S. – Number of Businesses 2002-2027.” Accessed on May 10, 2022.
-
IBISWorld. “Nursing Care Facilities in the U.S. – Market Size 2002-2027.” Accessed on May 10, 2022.
-
CDC. “Long-Term Care Providers and Services Users in the United States, 2015-2016.” Accessed on May 10, 2022.
-
Statista. “Average Monthly Cost of Nursing Home in the United States in 2020, by Room Type and State.” Accessed on May 10, 2022.
-
IBISWorld. “Nursing Care Facilities in the U.S. – Employment Statistics 2002-2027.” Accessed on May 10, 2022.
-
KFF. “Average Number of Certified Nursing Facility Beds.” Accessed on May 10, 2022.
-
National Library of Medicine. “Mortality in Nursing Home Residents: A Longitudinal Study Over Three Years.” Accessed on May 10, 2022.
-
CDC. “Nursing Home Care.” Accessed on March 20, 2026.
-
Department of Health and Human Services. “Nursing Homes.” Accessed on March 20, 2026.
-
National Library of Medicine. “Size and Demographics of Aging Populations.” Accessed on March 20, 2026.
- Industry Statistics
- Wedding Industry Statistics
- Yoga Industry Statistics
- Music Industry Statistics
- Landscaping Industry Statistics
- Bicycle Industry Statistics
- Coffee Industry Statistics
- Car Rental Industry Statistics
- Home Improvement Industry Statistics
- Insurance Industry Statistics
- Supplements Industry Statistics
- Golf Industry Statistics
- Fitness Industry Statistics
- US Media And Entertainment Industry Statistics
- Firearm Industry Statistics
- Financial Services Industry Statistics
- Health And Wellness Industry Statistics
- Trucking Industry Statistics
- Wine Industry Statistics
- Pet Industry Statistics
- Mobile App Industry Statistics
- Digital Marketing Industry Statistics
- Hotel Industry Statistics
- Retail Statistics
- Robotics Industry Statistics
- Jewelry Industry Statistics
- Appointment Scheduling statistics
- Restaurant Industry Statistics
- Food Delivery Statistics
- Food Truck Industry
- Fashion Industry
- Real Estate Industry
- US Film Industry
- US Beverage Industry
- USu202fFast Food Restaurants
- US Construction Industry
- US Book Industry
- Cosmetics Industry
- US Food Retail Industry
- US Pharmaceutical Industry
- US Healthcare Industry
- Airline Industry
- Automobile Industry
- Transportation Industry Statistics
- Event Industry Statistics
- Project Management Statistics
- Oil And Gas Industry Statistics
- Nursing Home Statistics
- Nursing Shortage Statistics
- Nursing Statistics
Author
Abby is a writer who is passionate about the power of story. Whether it’s communicating complicated topics in a clear way or helping readers connect with another person or place from the comfort of their couch. Abby attended Oral Roberts University in Tulsa, Oklahoma, where she earned a degree in writing with concentrations in journalism and business.