- Tech Industry Statistics
- MFA Statistics
- Streaming Services Statistics
- Mobile Vs. Desktop Usage Statistics
- AI Statistics
- Live Streaming Statistics
- Zoom Meeting Statistics
- Cord Cutting Statistics
- Digital Transformation Statistics
- Virtual Reality Statistics
- How Fast Is Technology Advancing
- Mobile Commerce Statistics
- SaaS Statistics
- Machine Learning Statistics
- Diversity In High Tech
- Cyber Security Statistics
- Ecommerce Statistics
- Tech Industry
- Gaming Industry
- Renewable Energy Job Creation
- Smartphone Industry
- Cybercrime Statistics
- Amazon Statistics
- Personalization Statistics
25 Live Streaming Statistics [2026]: Insights on Live Streaming in the U.S.
Research Summary: Live streaming has evolved into a dynamic form of entertainment, news, and communication, offering an engaging alternative to traditional media. As it becomes more ingrained in daily life, our updated research reveals key trends and statistics:
-
80% of live stream viewers prefer watching live content over reading articles.
-
The live streaming industry reached a staggering $59.14 billion in market value as of 2021.
-
By 2028, the global live streaming market is projected to soar to $223.98 billion.
-
Live streaming now constitutes 17% of all internet traffic.
-
Worldwide, live streaming represents 23% of total viewing time.
For deeper insights, we categorized the data as follows:
Business | Age | On-Demand | Trends and Projections
General Live Streaming Statistics
As technology advances, our video consumption habits have shifted. Today, live streaming accounts for nearly a fifth of all internet traffic. Here are essential facts about live streaming in the U.S. and globally:
-
Live content generates 27% more watch time than on-demand content.
-
67% of viewers are more likely to attend a concert after watching a live video event.
-
67% consider video quality the most critical factor when watching a live stream.
-
Twitch remains the leading live streaming platform with over 2.9 billion average concurrent viewers. Other notable platforms include YouTube Live, Facebook Live, and Caffeine.

Live Streaming In Business Statistics
If you’re a marketer aiming to engage customers effectively, understanding live streaming’s growth is crucial. According to our research:
-
79% of marketers highlight authentic interaction as a key benefit of live video.
-
Live streams typically receive 10% more engagement than pre-recorded content.
-
By 2021, 28% of marketers planned to increase their investment in live streaming.
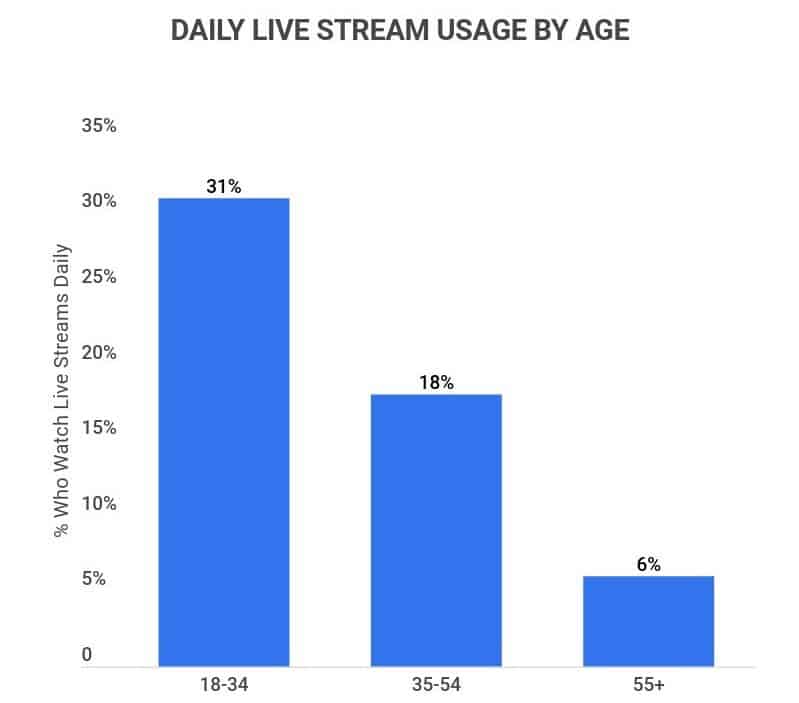
Live Streaming Statistics By Age
Live streaming’s popularity is particularly pronounced among younger generations. Here are findings from our research:
-
31% of individuals aged 18-34 watch live streams daily.
-
62% of those aged 55+ do not watch live streams.
-
60% of those aged 18-34 watch live streams weekly or more, compared to only 18% of those 55+.
-
88% of Millennials use video streaming services, leading their generational counterparts.
Live Streaming Frequency by Age
| Frequency (% Of Pop.) | Ages 18-34 | Ages 35-54 | Ages 55+ |
|---|---|---|---|
| Several Times per Day | 15% | 8% | 3% |
| Once per Day | 16% | 10% | 3% |
| Several Times per Week | 17% | 12% | 6% |
| Once per Week | 12% | 7% | 6% |
| Once per Month or More | 7% | 6% | 5% |
| Less Than Once per Month | 9% | 12% | 16% |
| Never | 24% | 45% | 62% |
On-Demand Streaming Statistics
Since the launch of Netflix, on-demand streaming has surged in popularity. Here are some insights on on-demand streaming in the U.S.:
-
Streaming accounts for 26% of all TV viewing time in the U.S.
-
78% of Americans subscribe to at least one major streaming service.
-
40% of American adults use streaming services daily.
-
Netflix leads as the largest on-demand streaming service, with 221.8 million subscribers.
Live Streaming Trends and Projections
From its rise in the 2010s to its current status, live streaming remains a primary source of entertainment. Here are some trends and projections:
-
Between 2020 and 2021, Twitch’s viewership grew by 45%.
-
Live stream sports events are most popular in China, with 54% of fans engaging.
Top Countries for Live Streaming Sports Events
| Country | % Of Fans Who Watch Live Streams | % Of Fans Who Watch Cable TV |
|---|---|---|
| China | 54% | 66% |
| Indonesia | 50% | 73% |
| Taiwan | 49% | 60% |
| Philippines | 42% | 59% |
| UAE | 42% | 54% |
| Peru | 42% | 84% |
| Argentina | 42% | 75% |
| Egypt | 42% | 63% |
| India | 41% | 66% |
| Saudi Arabia | 41% | 64% |
| Thailand | 41% | 59% |
| Chile | 40% | 72% |
| South Korea | 39% | 56% |
| Colombia | 38% | 81% |
| Malaysia | 38% | 60% |
| Brazil | 38% | 78% |
| Mexico | 38% | 61% |
| Vietnam | 37% | 71% |
| Hong Kong | 35% | 53% |
| Singapore | 29% | 36% |
| Spain | 28% | 68% |
| Australia | 27% | 62% |
| Italy | 25% | 67% |
| UK | 24% | 55% |
| Canada | 23% | 60% |
| Finland | 22% | 68% |
| Sweden | 21% | 49% |
| Denmark | 20% | 63% |
| Germany | 19% | 58% |
| USA | 17% | 53% |
| France | 16% | 74% |
| Japan | 13% | 63% |
From 2011 to 2017, the percentage of sporting events streamed live in the U.S. almost doubled.
Between 2021 and 2028, the live streaming industry is projected to grow at a CAGR of 21%.
Live Streaming Statistics FAQ
-
How many people watched live streams in 2021?
Though exact figures are elusive, millions engaged with live streams in 2021, with total watch time reaching 550 billion hours.
-
How many viewers does the average Twitch streamer have?
The average Twitch streamer attracts about 27.7 viewers per stream.
-
Live streaming appeals to a broad audience, with a notable preference among younger demographics.
-
What are the most viewers on a live stream?
Felix Baumgartner’s space jump holds the record for the most views on a live stream, with a peak of 8 million viewers.
Conclusion
From the early days of Netflix to the current landscape, live streaming and streaming services have transformed media consumption. The live streaming industry is valued at $59.14 billion and is expected to grow significantly, with a projected CAGR of 21% through 2028. With live streaming capturing 17% of internet traffic and 78% of Americans subscribing to at least one major streaming service, it is poised to rival traditional cable TV in the U.S., mirroring trends seen in countries like China and Indonesia.
Overall, the future of live streaming looks bright, with continued growth and innovation on the horizon.
Sources:
-
Grand View Research. “Video Streaming Market Size & Share Report, 2021-2028.” Accessed on February 28th, 2022.
-
Live Revolution. “Immersive Interactive Streaming for Live Events.” Accessed on February 28th, 2022.
-
TwitchTracker. “Twitch Statistics & Charts.” Accessed on February 28th, 2022.
-
Streamer. “The Big Live Streaming Platforms.” Accessed on February 28th, 2022.
-
Marketing Charts. “Top 5 Perceived Benefits of Live Streaming Video Events.” Accessed on February 28th, 2022.
-
Crowdfire. “How to Boost Your Live Streaming Engagement.” Accessed on February 28th, 2022.
-
Arena. “How to Increase Traffic and Engagement with Live Stream.” Accessed on February 28th, 2022.
-
Statista. “Frequency of watching livestream video in the United States as of July 2020, by age group.” Accessed on February 28th, 2022.
-
DataTrek. “Millennial Video Content Consumption Stats.” Accessed on February 28th, 2022.
-
TheGamer. “Twitch Sees A 45 Percent Viewership Increase In 2021.” Accessed on March 1st, 2022.
-
YouGovSport. “The rise of sports streaming: Where is it most popular?” Accessed on March 1st, 2022.
-
CNBC. “About one-quarter of U.S. TV time is spent watching streaming services, says Nielsen.” Accessed on March 1st, 2022.
-
The National Interest. “Majority of U.S. Households Have at Least Two Streaming Services.” Accessed on March 1st, 2022.
-
Fierce Video. “Over three-quarters of U.S. households subscribe to a streaming service.” Accessed on March 1st, 2022.
- Tech Industry Statistics
- MFA Statistics
- Streaming Services Statistics
- Mobile Vs. Desktop Usage Statistics
- AI Statistics
- Live Streaming Statistics
- Zoom Meeting Statistics
- Cord Cutting Statistics
- Digital Transformation Statistics
- Virtual Reality Statistics
- How Fast Is Technology Advancing
- Mobile Commerce Statistics
- SaaS Statistics
- Machine Learning Statistics
- Diversity In High Tech
- Cyber Security Statistics
- Ecommerce Statistics
- Tech Industry
- Gaming Industry
- Renewable Energy Job Creation
- Smartphone Industry
- Cybercrime Statistics
- Amazon Statistics
- Personalization Statistics
Author
Jack Flynn is a writer for Zippia. In his professional career he’s written over 100 research papers, articles and blog posts. Some of his most popular published works include his writing about economic terms and research into job classifications. Jack received his BS from Hampshire College.