- Income Statistics
- Average PTO Days
- What Percentage of Americans Live Paycheck to Paycheck?
- Average American Income
- Millionaire Statistics
- Average Salary out of College
- Average Bonus Statistics
- Minimum Wage Statistics
- Union Benefits Statistics
- Savings Statistics
- Average Annual Raise
- Income Inequality Statistics
- How Many People Make Over 100k?
- Average 401(k) Sstatistics
- Average Net Worth Statistics
- $100k After-Tax Income By State
- Average Global Income
20+ Crucial Minimum Wage Statistics [2026]: Facts, Predictions, And More
Minimum wage research summary. As we enter 2026, it’s evident that while individual states have made strides in adjusting their minimum wages, the federal minimum wage has remained stagnant. This stagnation continues to impact millions as the cost of living escalates. Our thorough investigation into the current landscape of minimum wage reveals critical insights:
-
Approximately 1.5 million Americans (or 1.5% of all hourly paid workers) earn at or below the federal minimum wage.
-
40% of U.S. workers earning at or below the minimum wage are under 25 years old.
-
When adjusted for inflation, the federal minimum wage of $1.60 in 1968 would be equivalent to over $14 today. This illustrates that minimum wage earners in 1968 had almost 90% more purchasing power than their current counterparts.
-
Since its last adjustment in 2009, the federal minimum wage has decreased in purchasing power by nearly 40%.
-
65% of Americans support increasing the minimum wage to $15 per hour.
For more in-depth analysis, we’ve categorized the data as follows:
Worker Demographics | Gender | Hourly Workers | State and Industry
General minimum wage statistics
The minimum wage has a profound impact on millions of working-class individuals and families across the U.S. To better understand its effects, we compiled the most pertinent facts and statistics:
-
1.5 million Americans earn at or below the federal minimum wage.
However, as state minimum wages vary significantly, this number doesn’t accurately reflect the situation across all 50 states. Notably, over a third of the total workforce (approximately 50 million Americans) earns less than $15 per hour.
-
200,000 U.S. workers earn exactly the federal minimum wage of $7.25 per hour.
This figure represents a mere 0.1% of the working population, yet it signifies thousands of families struggling with the cost of living.
-
The minimum wage last increased from $6.55 to $7.25 in 2009.
From 2007 to 2009, the federal minimum wage underwent a series of increases totaling 24%. However, since then, it has remained unchanged for 17 years.
-
Working an average of 40 hours per week, a minimum wage earner makes only $15,000 annually.
This figure is significantly below the average U.S. income of $55,000 and places many workers below the poverty line in various states. For instance, a single individual earning less than $17,000 is classified as below the poverty line in states like New York, Virginia, and others.
-
65% of Americans support raising the minimum wage to $15 per hour.
Currently, only a dozen states are pursuing this goal, including:
Minimum wage statistics by worker demographics
The impact of minimum wage varies across demographics, with certain groups facing greater challenges. Below are key insights regarding the demographics of minimum wage workers:
-
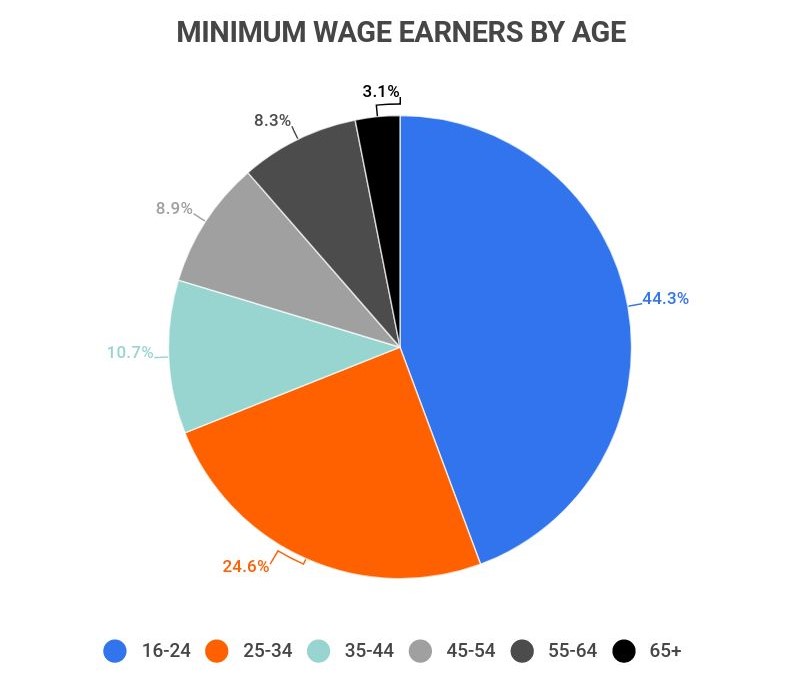
57% of minimum wage earners are over the age of 25.
Notably, younger workers earn minimum wage at significantly higher rates, with 70% of minimum wage earners under 34 years old, while only 10% are over 55.
Percent of total minimum wage workers by age group
Age group % of total minimum wage workers 16-24 40% 24-34 25% 35-44 10% 45-54 9% 55-64 9% 65+ 3% -
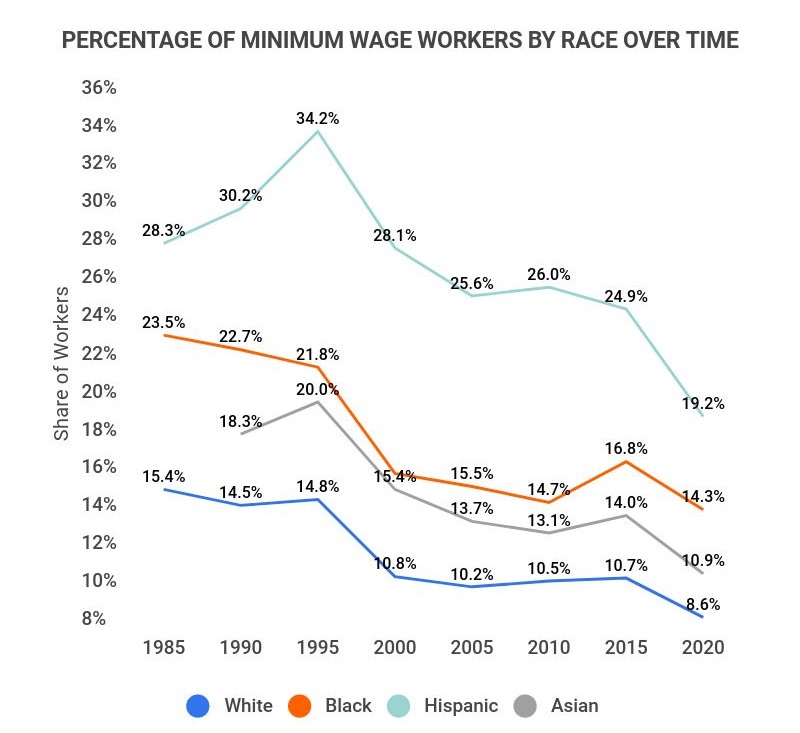
White Americans compose the majority of minimum wage workers, totaling 800,000.
In comparison, 200,000 are Hispanic or Latino, followed by 150,000 Black workers and 50,000 Asian workers.
It’s worth noting that while White Americans represent a majority of minimum wage workers, they also comprise a significant portion of the overall workforce (around 61%), highlighting that sheer numbers do not indicate which demographic experiences the highest percentage of minimum wage earners.
Number of minimum wage workers by race
Race # of minimum wage workers (in thousands) White 800K Hispanic or Latino 200K Black 150K Asian 50K -
Hispanic workers are most likely to earn poverty-level wages, with 20% of them falling into this category.
Black Americans also see elevated rates, with 15% of their population earning at or below the poverty line. In contrast, only 11% of Asian workers and 9% of White workers earn poverty-level wages.
-
32% of Black workers and 31% of Hispanic workers would benefit from an increase to a $15 minimum wage.
This is considerably higher than the 20% of White American workers who would also see a raise, indicating that Black and Hispanic Americans are disproportionately affected by lower wages.
Minimum wage statistics by gender
The minimum wage impacts genders differently, reflecting longstanding disparities in the workplace. Our research indicates that:
-
60% of minimum wage earners are women.
This contrasts with 40% of men, despite the U.S. workforce being nearly evenly split (52% men and 48% women).
-
As of 2021, 1.5% of female workers are minimum wage employees.
Conversely, only 0.9% of male workers are minimum wage employees, representing a 67% lower rate than their female counterparts.
Percent of male and female workers earning minimum wage
Year % of male workers who earn minimum wage % of female workers who earn minimum wage 2015 2.5% 4.1% 2016 1.9% 3.4% 2017 1.7% 2.8% 2018 1.6% 2.6% 2019 1.3% 2.6% 2020 1% 2% 2021 1% 1.5% 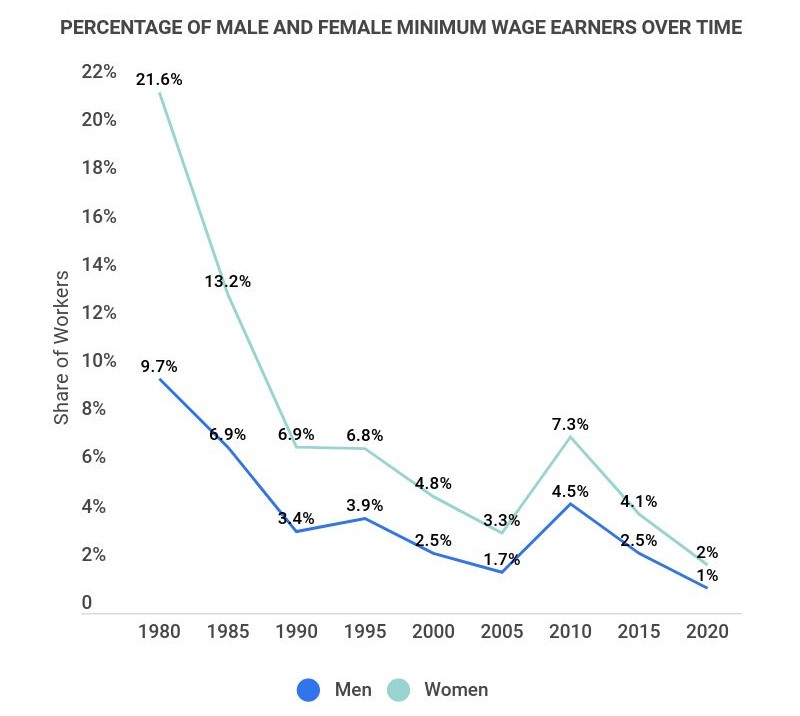
-
58% of women would see a raise if the minimum wage increased to $15 per hour.
This equates to approximately 18 million women in the U.S. workforce, underscoring why women are more likely to advocate for a minimum wage increase compared to men.
-
Arkansas, Louisiana, and Pennsylvania have the highest proportion of female minimum wage workers.
In these states, up to 70% of all minimum wage jobs are held by women, with none of these states offering a minimum wage above $7.50 per hour.
Minimum wage statistics by hourly workers
Minimum wage primarily affects hourly workers, as they must be paid at least $7.25 per hour. Here are some relevant facts about these workers:
-
As of 2021, 80 million Americans over 16 are hourly employees.
This accounts for over 55% of the American workforce.
-
Approximately 28% of hourly workers over 18 are classified as “near-minimum-wage” workers.
This translates to roughly 22 million hourly workers in the U.S. who earn just above the minimum wage, highlighting that hourly workers are more likely to earn a salary near the minimum wage compared to salaried workers.
-
30% of minimum wage workers are parents.
That means nearly a third of all hourly minimum wage earners in the U.S. are supporting children while earning a wage insufficient to cover basic living costs. The average annual cost of raising a child is around $14,000, while a single parent on minimum wage can expect to make only $15,000 each year.
Minimum wage statistics by state and industry
Minimum wage rates vary across states and industries, with some states implementing wages as high as $15 per hour while others continue with the federal minimum of $7.25. Below are some key insights:
-
California boasts the highest minimum wage at $16.50 per hour as of 2026.
However, Washington D.C. has a higher minimum wage overall, at $17.00 per hour. Other states with high minimum wages include: Massachusetts ($15.00), Oregon ($15.00), and New Jersey ($15.00).
-
21 states still maintain minimum wages of $7.25 or less.
Nearly half of U.S. states continue to offer minimum wages that align with the federal minimum wage, particularly in the southeastern and central regions of the country.
-
The Leisure and Hospitality industry employs the most minimum wage workers, totaling 700,000.
In comparison, the Education and Health Services sector follows with only 80,000 workers, illustrating that the Leisure and Hospitality industry has nearly 800% more minimum wage workers than the second-largest sector.
Number of minimum wage workers by industry
Industry # of minimum wage workers Leisure and Hospitality 700,000 Education and Health Services 80,000 Public Sector 70,000 Wholesale and Retail Trade 60,000 Other Services 60,000 Manufacturing 30,000 Transportation and Utilities 25,000 Professional and Business Services 20,000 Construction 10,000 Financial Activities 7,000 Information 2,500 Mining, Quarrying, and Oil and Gas Extraction 1,500
Minimum wage by state
| State | Current minimum wage (2026) |
|---|---|
| Alabama | $7.25 |
| Alaska | $11.00 |
| Arizona | $15.00 |
| Arkansas | $11.00 |
| California | $16.50 |
| Colorado | $14.50 |
| Connecticut | $15.00 |
| Delaware | $12.00 |
| D.C. | $17.00 |
| Florida | $12.00 |
| Georgia | $7.25 |
| Hawaii | $13.00 |
| Idaho | $7.25 |
| Illinois | $14.00 |
| Indiana | $7.25 |
| Iowa | $8.00 |
| Kansas | $7.25 |
| Kentucky | $7.25 |
| Louisiana | $7.25 |
| Maine | $14.50 |
| Maryland | $13.50 |
| Massachusetts | $15.00 |
| Michigan | $12.00 |
| Minnesota | $11.00 |
| Mississippi | $7.25 |
| Missouri | $12.00 |
| Montana | $10.00 |
| Nebraska | $11.00 |
| Nevada | $11.00 |
| New Hampshire | $7.25 |
| New Jersey | $15.00 |
| New Mexico | $12.00 |
| New York | $15.00 |
| North Carolina | $7.25 |
| North Dakota | $7.25 |
| Ohio | $11.00 |
| Oklahoma | $7.25 |
| Oregon | $15.00 |
| Pennsylvania | $7.25 |
| Rhode Island | $13.50 |
| South Carolina | $7.25 |
| South Dakota | $10.80 |
| Tennessee | $7.25 |
| Texas | $7.25 |
| Utah | $7.25 |
| Vermont | $14.00 |
| Virginia | $12.00 |
| Washington | $15.74 |
| West Virginia | $8.75 |
| Wisconsin | $7.25 |
| Wyoming | $7.25 |
Minimum wage statistics FAQ
-
What percentage of Americans make minimum wage?
Roughly 1.5% of all Americans earn the federal minimum wage. While this might seem minimal, it represents over a million workers nationwide. Importantly, this reflects a significant decrease over time.
For instance, in 2015, about 2.5% of male workers earned minimum wage, while 4.1% of female workers did. This indicates that the number of workers earning minimum wage has diminished by more than half in the past decade.
-
What percentage of American workers earn less than $15 an hour?
Over a third of the workforce earns less than $15 per hour. This translates to around 50 million Americans.
These figures are particularly prevalent in states maintaining the federal minimum wage of $7.25, which is especially detrimental in high-cost living areas.
It’s no surprise that 65% of Americans now advocate for increasing the federal minimum wage to at least $15 per hour.
-
When was the minimum wage last raised in the United States?
The federal minimum wage was last adjusted in 2009. During the period from 2007 to 2009, the minimum wage experienced consistent increases. In 2007, it was set at $5.85, but by 2009 it had risen to $7.25.
This equated to a 24% escalation over three years, yet it has remained unchanged for 17 years since then.
-
Which state has the highest minimum wage?
California currently has the highest minimum wage. As of 2026, California’s state minimum wage has reached $16.50, although Washington D.C. tops the list at $17.00.
Other states among the highest include: Massachusetts ($15.00), Oregon ($15.00), and New Jersey ($15.00).
-
What were the minimum wage statistics in 2022?
Minimum wage statistics from 2022 reflect the impact of inflation on federal minimum wage. Since the last adjustment in 2009, the purchasing power of $7.25 has decreased by nearly 40%, meaning that $7.25 in 2009 equates to about $9.96 today.
-
Why are people advocating for a $15 minimum wage?
Advocates argue that $7.25 is insufficient for covering living costs. Rising inflation, alongside increasing expenses in healthcare, education, and consumer goods, has made it challenging for many individuals to survive on a single minimum-wage job.
Proponents of a $15 minimum wage believe workers deserve a livable wage that fairly compensates them for their time and acknowledges the challenges associated with their working conditions, particularly in demanding or hazardous environments.
Conclusion
Despite the rising cost of living and inflation, the federal minimum wage has not seen an increase in 17 years. The disparity between states continues, with many retaining the federal minimum wage of $7.25 while others have opted for higher rates.
Millions of Americans, particularly hourly workers, remain directly affected by these wage levels. On average, they earn only $15,000 per year, which falls short of the average child-rearing cost of over $14,000 annually.
In light of these circumstances, it is not surprising that 65% of Americans now endorse raising the minimum wage to $15 per hour.
References:
-
Statista. “Percentage distribution of workers paid hourly rates with earnings at or below minimum wage in the U.S. 2021, by age.” Accessed on July 11th, 2022.
-
EPI. “The federal minimum wage has been eroded by decades of inaction.” Accessed on July 11th, 2022.
-
Bloomberg. “One in Three U.S. Workers Are Earning Less Than $15 an Hour.” Accessed on July 11th, 2022.
-
BLS. “Characteristics of minimum wage workers, 2020.” Accessed on July 11th, 2022.
-
DOL. “History of Changes to the Minimum Wage Law.” Accessed on July 11th, 2022.
-
GovDocs. “How Many States Have a $15 Minimum Wage?” Accessed on July 11th, 2022.
-
Statista. “Number of workers paid hourly rates with earnings at or below minimum wage in the United States 2021, by race or ethnicity.” Accessed on July 11th, 2022.
-
EPI. “Raising the federal minimum wage to $15 by 2025 would lift the pay of 32 million workers.” Accessed on July 11th, 2022.
-
Pew Research Center. “More women than men earn the federal minimum wage.” Accessed on July 11th, 2022.
-
Statista. “Share of workers paid hourly rates at or below prevailing federal minimum wage in the United States from 1980 to 2021, by gender.” Accessed on July 11th, 2022.
-
Forbes. “The States Where Women Earn The Least.” Accessed on July 11th, 2022.
-
Pew Research Center. “5 facts about the minimum wage.” Accessed on July 11th, 2022.
-
Fatherly. “Single Parents Need to Earn Much, Much More To Actually Make a “Living Wage”.” Accessed on July 11th, 2022.
-
NCSL. “State Minimum Wages.” Accessed on July 11th, 2022.
-
BLS “CPI Inflation Calculator.” Accessed on February 10, 2023.
-
BLS “Characteristics of minimum wage workers, 2021.” Accessed on February 10, 2023.
- Income Statistics
- Average PTO Days
- What Percentage of Americans Live Paycheck to Paycheck?
- Average American Income
- Millionaire Statistics
- Average Salary out of College
- Average Bonus Statistics
- Minimum Wage Statistics
- Union Benefits Statistics
- Savings Statistics
- Average Annual Raise
- Income Inequality Statistics
- How Many People Make Over 100k?
- Average 401(k) Sstatistics
- Average Net Worth Statistics
- $100k After-Tax Income By State
- Average Global Income
Author
Jack Flynn is a writer for Zippia. In his professional career he’s written over 100 research papers, articles and blog posts. Some of his most popular published works include his writing about economic terms and research into job classifications. Jack received his BS from Hampshire College.