Find a Job You Really Want In

When evaluating your job’s benefits package, you may not realize that one of the most significant aspects is often overlooked: maternity leave. If starting a family is on your agenda, it’s crucial to understand that, as of 2026, only a handful of states provide paid family leave, leaving many expectant mothers without adequate protections.
Interestingly, our exploration into this vital topic revealed a compelling statistical correlation:
The more religious a state, the less likely it is to offer paid maternity leave.
Furthermore, states where a higher percentage of women gave birth while actively participating in the workforce tend to have more comprehensive maternity laws. This inquiry into maternity leave has expanded to also examine the influence of religious practices on these policies.
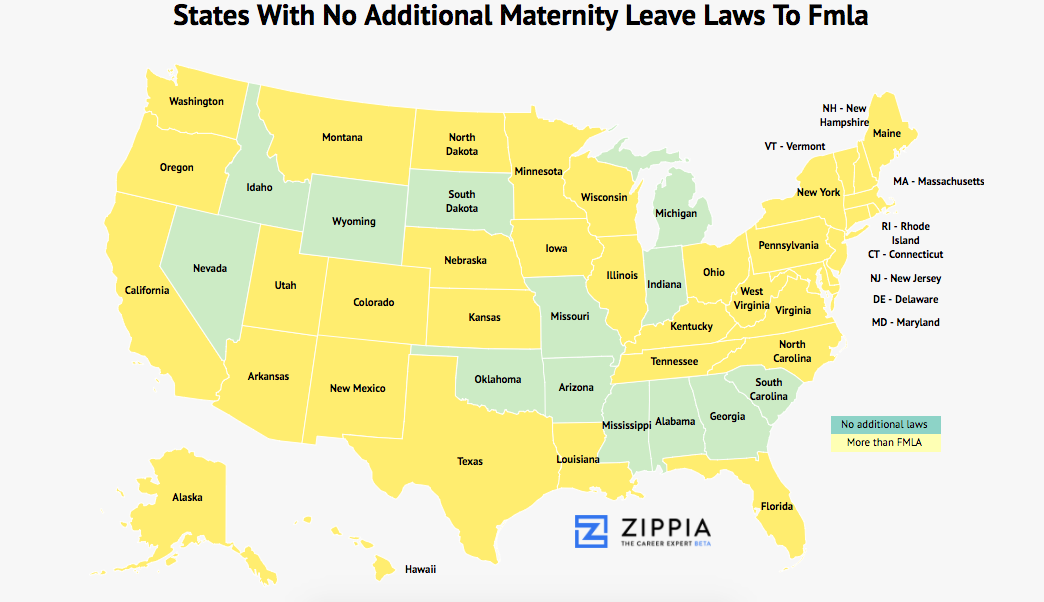
Here’s the map, with detailed data for each state provided at the bottom of the page:

How We Ranked States’ Maternity Laws
We created a ranking for all fifty states based on the protections offered to parents under state laws, assessing whether states have enacted laws that exceed federal family leave requirements. States scoring highest provide a range of comprehensive laws related to pregnancy, including paid leave options, extended durations, rights for nursing mothers, paid sick days, job protection beyond the Family and Medical Leave Act (FMLA), and additional days for pregnancy-related disabilities.
Conversely, twelve states have implemented no additional protections beyond FMLA.
Who Needs Maternity Leave Laws When You Have Commandments?
This study initially aimed to identify the “best states for workers to have a baby,” based on the quality of paid maternity leave policies. However, the lack of relevant, standardized data from companies—where maternity leave is often just one piece of a broader benefits package—complicated our efforts. These offerings can vary significantly, akin to health care plans and office perks.
Consequently, our focus shifted to the minimum requirements set by individual states, especially upon discovering that a dozen states require no paid maternity leave at all.
Where Religion Comes Into the Equation
It’s evident that many of the states with the least maternity protections also tend to be more religious, suggesting a connection between faith and policy. An analysis of the data shows that states with higher religiosity correlate with fewer maternity protections.
The accompanying map of states with limited maternity protections closely resembles the Bible Belt, reinforcing our observations.
Using data from a Pew Research survey, we found a strong negative correlation between the importance of religion in respondents’ lives and the quality of maternity leave laws in those states, even when controlling for income.
In summary, the more religious a state’s population, the less likely it is to provide paid maternity leave for mothers.
Additionally, states characterized by high levels of religiosity tend to have lower percentages of women who worked in the year following childbirth. Even within religious organizations that advocate for pro-family beliefs, there can be limited maternity leave options, as reported:
Religious organizations that are pro-life and pro-family often provide minimal family leave policies, with some offering no paid options at all.
We Controlled for Income, But It Still Plays a Subtle Role
The median length of maternity leave is substantially longer than that of paternity leave (11 weeks vs. one week). However, women from lower-income households tend to take shorter maternity leaves compared to their higher-income counterparts. Interestingly, higher-income individuals are more likely to have access to comprehensive paid leave benefits, but they often utilize a shorter duration of full-pay leave. Lower-income workers tend to maximize their leave time, indicating a reliance on those benefits for financial stability.
Research also indicates that higher-income individuals are informed about Paid Family Leave (PFL) policies by their employers more frequently than lower-income individuals, who may rely on informal channels for information.
So, What Gives?
In states lacking maternity leave laws, the predominant question is “who provides?”—and often, it is not the religious institutions that claim to support families. The responsibility appears to fall more heavily on the federal government.
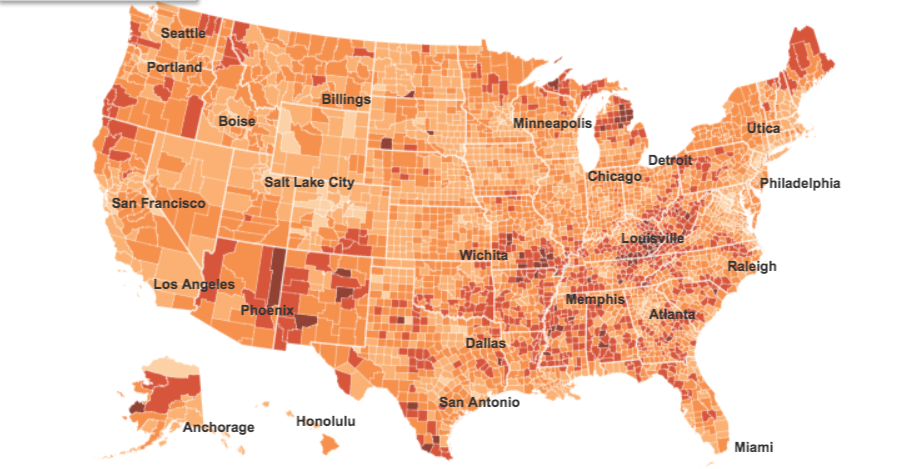
Income plays a critical role in societal studies, as many states without maternity protections also depend heavily on government assistance programs. This New York Times map illustrates where residents’ incomes are significantly supported by federal programs such as Medicare, Medicaid, and Social Security.
Those Who Need It the Most Have the Least Access to It
Indeed, our findings illustrate that individuals residing in states with minimal maternity protections often rely heavily on food stamps, unemployment benefits, and Medicaid.
Economists have demonstrated that when paid leave is available, individuals are more likely to utilize it, reducing the chance of exiting the workforce altogether. This is particularly crucial for low-income parents who cannot afford to take unpaid leave, especially under FMLA guidelines. Studies show that women with access to paid maternity leave are more likely to return to work after childbirth.
A Note on Family and Medical Leave Act (FMLA) and Paid Maternity Leave
The FMLA provides job protection but not compensation, which can complicate the financial challenges associated with pregnancy. It covers only 59% of U.S. workers, leaving two in five women ineligible for leave under its provisions.
FMLA mandates that most employers allow twelve weeks of unpaid maternity (or paternity) leave after the birth or adoption of a child while ensuring the employee can return to their position or a similar role with the same benefits. However, it lacks any stipulations for compensation.
In contrast, Paid Family Leave (PFL) programs, like California’s, provide financial support, offering a portion of the employee’s salary for a designated timeframe through disability or unemployment benefits.
California Ahead of the Pack
Our scoring system ranges from one to eleven. Initially, we adopted a ten-point scale, but California’s robust protections for pregnant women warranted a unique category, earning it an eleven.

In California, employees can receive 55% of their earnings for up to six weeks, with that figure rising to 70% starting in 2018. The state also offers job-protected paid sick days, pregnancy accommodations, and protections for nursing mothers.
While these provisions are beneficial for Californians, twelve states scored only one point for having no additional protections beyond federal FMLA.
Where Does Politics Fit In All of This?
It’s well-known that religious beliefs often align with conservative politics, which helps explain why more conservative states frequently lack legal protections for expectant and new mothers. However, the reasons for varying levels of government spending on social programs are complex and influenced by tax revenue. Notably, of the ten states investing the least in social programs, all but one—Florida—voted Republican in the last presidential election, indicating that funding allocations may reflect political ideologies rather than purely religious motivations.
Mandating employer responsibility for employee health is challenging, particularly when perceived as an entitlement program that could burden small businesses. Critics argue that enforced maternity leave laws may negatively impact small businesses that struggle to manage the costs of both losing a key employee and compensating them during their leave.
While this argument has merit, the discussion surrounding government roles in business intersects with the data that reveals some intriguing, and potentially contradictory, insights.
Religiosity and Maternity Leave by State
| State | Maternity Leave Score | Percentage Of New Moms Who Worked That Year | Very/Somewhat Important | Not Too/At All Important |
|---|---|---|---|---|
| California | 11 | 57 | 73% | 27% |
| New York | 10 | 61 | 72% | 27% |
| Rhode Island | 9 | 75 | 73% | 28% |
| Connecticut | 9 | 68 | 69% | 31% |
| New Jersey | 9 | 64 | 78% | 20% |
| Hawaii | 9 | 61 | 76% | 23% |
| Oregon | 9 | 61 | 70% | 29% |
| Vermont | 8 | 70 | 57% | 43% |
| Massachusetts | 8 | 68 | 63% | 36% |
| Illinois | 8 | 63 | 77% | 23% |
| Minnesota | 7 | 70 | 74% | 26% |
| Maine | 7 | 68 | 63% | 36% |
| Washington | 7 | 56 | 67% | 33% |
| Wisconsin | 6 | 72 | 75% | 24% |
| Maryland | 6 | 69 | 75% | 24% |
| Louisiana | 6 | 61 | 90% | 10% |
| Nebraska | 5 | 71 | 79% | 20% |
| Delaware | 5 | 68 | 77% | 21% |
| Arkansas | 5 | 62 | 86% | 12% |
| Montana | 5 | 62 | 69% | 30% |
| Colorado | 5 | 61 | 75% | 25% |
| Alaska | 5 | 56 | 70% | 29% |
| Utah | 5 | 50 | 73% | 25% |
| Tennessee | 4 | 64 | 89% | 11% |
| West Virginia | 4 | 54 | 86% | 12% |
| Iowa | 3 | 71 | 79% | 20% |
| New Hampshire | 3 | 70 | 60% | 38% |
| Kansas | 3 | 67 | 79% | 21% |
| Ohio | 3 | 66 | 81% | 19% |
| Virginia | 3 | 64 | 81% | 18% |
| Florida | 3 | 63 | 78% | 22% |
| North Carolina | 3 | 62 | 84% | 16% |
| North Dakota | 2 | 74 | 76% | 24% |
| Indiana | 2 | 66 | 78% | 21% |
| Pennsylvania | 2 | 65 | 77% | 23% |
| Kentucky | 2 | 63 | 86% | 14% |
| New Mexico | 2 | 56 | 79% | 19% |
| Texas | 2 | 54 | 86% | 15% |
| South Dakota | 1 | 73 | 81% | 18% |
| Missouri | 1 | 66 | 82% | 17% |
| Michigan | 1 | 65 | 77% | 22% |
| South Carolina | 1 | 64 | 85% | 14% |
| Georgia | 1 | 62 | 84% | 15% |
| Mississippi | 1 | 62 | 89% | 10% |
| Alabama | 1 | 61 | 90% | 10% |
| Nevada | 1 | 60 | 73% | 26% |
| Oklahoma | 1 | 58 | 87% | 12% |
| Wyoming | 1 | 58 | 77% | 22% |
| Idaho | 1 | 56 | 76% | 25% |
| Arizona | 1 | 55 | 75% | 24% |
Author
David Luther was the Content Marketing Editor for the Zippia Advice blog. He developed partnerships with external reporting agencies in addition to generating original research and reporting for the Zippia Career Advice blog. David obtained his BA from UNC Chapel Hill.