Exploding into Independence Day: States That Use the Most Fireworks in 2026
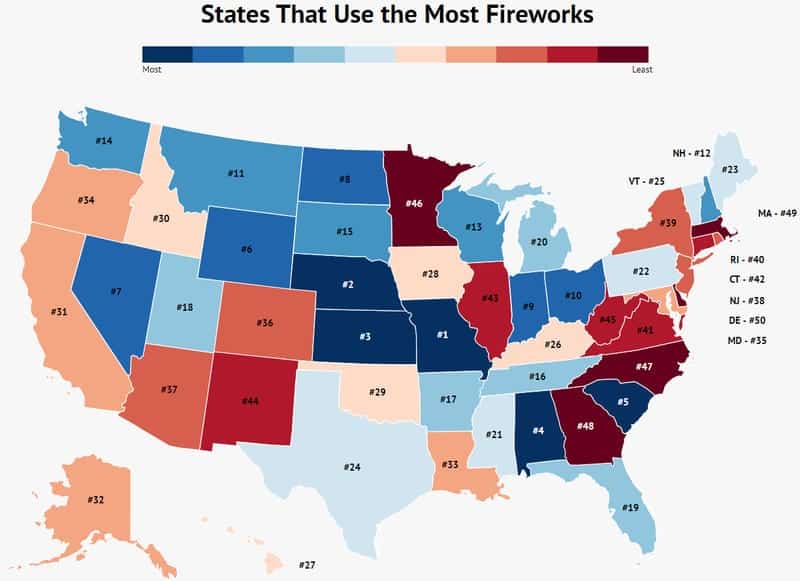
The state with the highest fireworks usage is Missouri, with 43.28 million firework imports and 6.9 imports per capita.
Conversely, the state with the least fireworks usage is Delaware, which has no firework imports.
Only 4 states have a complete ban on consumer fireworks: Massachusetts, New York, New Jersey, and Delaware.
Each year, Americans set off over 285.3 million pounds of consumer fireworks on the Fourth of July.
As the Fourth of July approaches, many Americans gear up for a day filled with food, family, and, of course, fireworks. This year, Americans are estimated to consume around 155 million hot dogs and ignite approximately 30,000 tons of explosives in celebration. Regardless of how skilled the grill master may be, the fireworks remain the highlight of the day.
With firework prices rising approximately 15% this year, it’s essential to plan ahead for those dazzling displays. Some states are known for their remarkable firework shows, while others may be more reserved in their celebrations. We analyzed the data to reveal which states are the true champions of fireworks and where the skies will light up in vibrant red, white, and blue.
Methodology for Determining Firework Usage by State
The data on firework imports comes from the US Trade Census. To ensure accuracy, we considered population figures from the US Census, allowing us to calculate fireworks usage per capita. This approach helped us identify states with significant firework economic activity and consumption.
1. Missouri

Imports : 42,283,229
Imports Per Capita : 6.9
Missouri takes the lead as the state that launches the most fireworks in the nation, with over 42 million imported annually. This translates to nearly 7 fireworks per person. Despite strict regulations on when and what can be ignited, residents find ways to celebrate their independence with a bang.
2. Nebraska

Imports : 11,182,825
Imports Per Capita : 5.9
Nebraska ranks second, with just enough fireworks imported to allow each resident to shoot off nearly 6 fireworks. If you happen to be among the lucky few who can claim extra, that means a grand total of 24 fireworks for a small group of friends. Cheers to celebrating freedom!
3. Kansas

Imports : 12,247,314
Imports Per Capita : 4.2
Kansas, with its wide-open spaces, could be expected to have an abundance of firework displays. Though it imports over 12 million fireworks, that amounts to only 4 fireworks per person. A missed opportunity for a grand celebration!
4. Alabama

Imports : 19,396,430
Imports Per Capita : 4.0
Alabama imports nearly 20 million fireworks each year, providing enough for each resident to launch 4 fireworks. It’s a solid showing for this Southern state!
5. South Carolina

Imports : 18,999,940
Imports Per Capita : 3.8
South Carolina rounds out the top five, importing almost 19 million fireworks annually. Just imagine the excitement of witnessing such a display!
6. Wyoming

Imports : 1,853,759
Imports Per Capita : 3.2
Wyoming may have a smaller firework import count, but it still manages to provide enough for each resident to enjoy around 3 fireworks each—proving that sometimes, less can be more.
7. Nevada

Imports : 7,548,350
Imports Per Capita : 2.6
Nevada imports approximately 7.5 million fireworks, which gives each resident about 2.6 fireworks to enjoy. This count doesn’t reflect the numerous displays put on by casinos, which add a significant visual impact to the state’s celebrations.
8. North Dakota

Imports : 1,913,692
Imports Per Capita : 2.5
North Dakota may have fewer imports, but what it lacks in quantity, it makes up for in quality. Each resident can enjoy about 2.5 fireworks, and the state is known for its impressive public firework shows during celebrations.
9. Indiana

Imports : 16,375,305
Imports Per Capita : 2.5
Indiana imports over 16 million fireworks, providing each resident with about 2.5 fireworks. It’s a surprising figure that underscores the state’s enthusiasm for Independence Day festivities.
10. Ohio

Imports : 26,514,838
Imports Per Capita : 2.3
Ohio’s fireworks imports exceed 26 million, but that only translates to around 2.3 fireworks per person. While impressive in numbers, it’s not quite the bang for each buck one might hope for.
Celebrating Fireworks Across the States
The Fourth of July fireworks industry is booming, and it’s evident that Missouri leads the charge, but it’s far from the only state igniting these colorful displays. Use our comprehensive table below to see how your state ranks in fireworks imports and celebrate accordingly!
| State | Imports | Imports Per Capita | Rank |
|---|---|---|---|
| Missouri | 42,283,229 | 6 | 1 |
| Nebraska | 11,182,825 | 5 | 2 |
| Kansas | 12,247,314 | 4 | 3 |
| Alabama | 19,396,430 | 3 | 4 |
| South Carolina | 18,999,940 | 3 | 5 |
| Wyoming | 1,853,759 | 3 | 6 |
| Nevada | 7,548,350 | 2 | 7 |
| North Dakota | 1,913,692 | 2 | 8 |
| Indiana | 16,375,305 | 2 | 9 |
| Ohio | 26,514,838 | 2 | 10 |
| Montana | 1,636,271 | 1 | 11 |
| New Hampshire | 2,097,088 | 1 | 12 |
| Wisconsin | 7,987,014 | 1 | 13 |
| Washington | 9,365,359 | 1 | 14 |
| South Dakota | 914,388 | 1 | 15 |
| Tennessee | 6,690,239 | 1 | 16 |
| Arkansas | 2,649,113 | 0.89 | 17 |
| Utah | 2,671,881 | 0.88 | 18 |
| Florida | 18,065,772 | 0.87 | 19 |
| Michigan | 7,236,063 | 0.73 | 20 |
| Mississippi | 2,069,296 | 0.69 | 21 |
| Pennsylvania | 8,506,912 | 0.67 | 22 |
| Maine | 809,437 | 0.61 | 23 |
| Texas | 17,158,599 | 0.61 | 23 |
| Vermont | 355,610 | 0.57 | 25 |
| Kentucky | 2,405,186 | 0.54 | 26 |
| Hawaii | 672,925 | 0.47 | 27 |
| Iowa | 1,303,879 | 0.42 | 28 |
| Oklahoma | 1,482,712 | 0.38 | 29 |
| Idaho | 585,801 | 0.35 | 30 |
| California | 13,000,442 | 0.33 | 31 |
| Alaska | 226,399 | 0.31 | 32 |
| Louisiana | 1,082,455 | 0.23 | 33 |
| Oregon | 891,775 | 0.22 | 34 |
| Maryland | 1,256,016 | 0.21 | 35 |
| Colorado | 879,850 | 0.16 | 36 |
| Arizona | 1,034,060 | 0.15 | 37 |
| New Jersey | 1,248,003 | 0.14 | 38 |
| New York | 2,841,791 | 0.14 | 38 |
| Rhode Island | 138,439 | 0.13 | 40 |
| Virginia | 1,113,267 | 0.13 | 40 |
| Connecticut | 432,540 | 0.12 | 42 |
| Illinois | 1,530,614 | 0.12 | 42 |
| New Mexico | 223,390 | 0.11 | 44 |
| West Virginia | 173,825 | 0.1 | 45 |
| Minnesota | 484,924 | 0.09 | 46 |
| North Carolina | 197,652 | 0.02 | 47 |
| Washington D.C. | 12,995 | 0.02 | 47 |
| Georgia | 138,007 | 0.01 | 48 |
| Massachusetts | 80,953 | 0.01 | 49 |
| Delaware | 0 | 0 | 50 |
Author
Kathy is the head of content at Zippia with a knack for engaging audiences. Prior to joining Zippia, Kathy worked at Gateway Blend growing audiences across diverse brands. She graduated from Troy University with a degree in Social Science Education.