- Job Seeker Statistics
- Career Change statistics
- Internship Statistics
- Job Search Statistics
- Average Number Of Jobs Applied
- Average Salary Increase When Changing Jobs
- Part Time Job Statistics
- Age Discrimination Statistics
- Networking Statistics
- Interview Statistics
- Average Number of Jobs In A Lifetime
- Resume Statistics
- Side Hustle Statistics
- Teacher Statistics
Teacher Research Summary (2026). Teachers are a vital component of our society, contributing significantly to the education and development of future generations. However, the profession faces ongoing challenges, including a persistent teacher shortage. As we move into 2026, it is crucial to explore key statistics that shed light on the current state of teaching in the U.S.
-
Approximately 3.8 million teachers work in public and private schools across the United States.
-
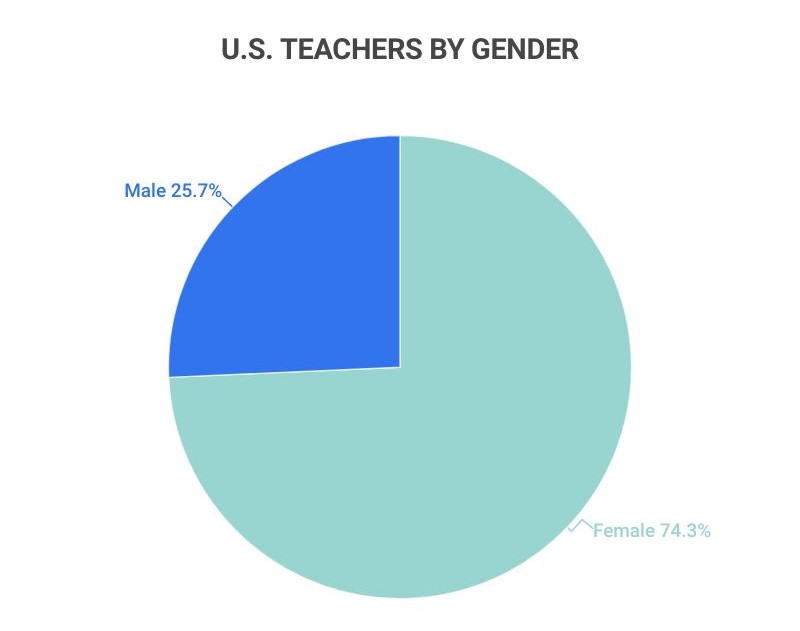
74.3% of teachers are female, while 25.7% are male.
-
The average student-to-teacher ratio stands at 15:1.
-
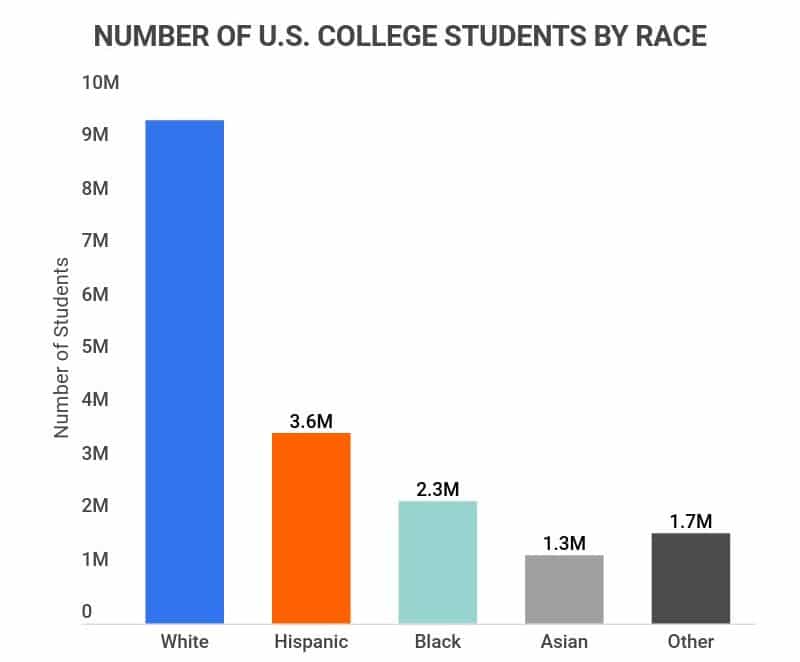
The demographic composition of teachers includes 79.3% identifying as white, 9.3% as Hispanic, 6.7% as Black or African American, and 2.1% as Asian.
-
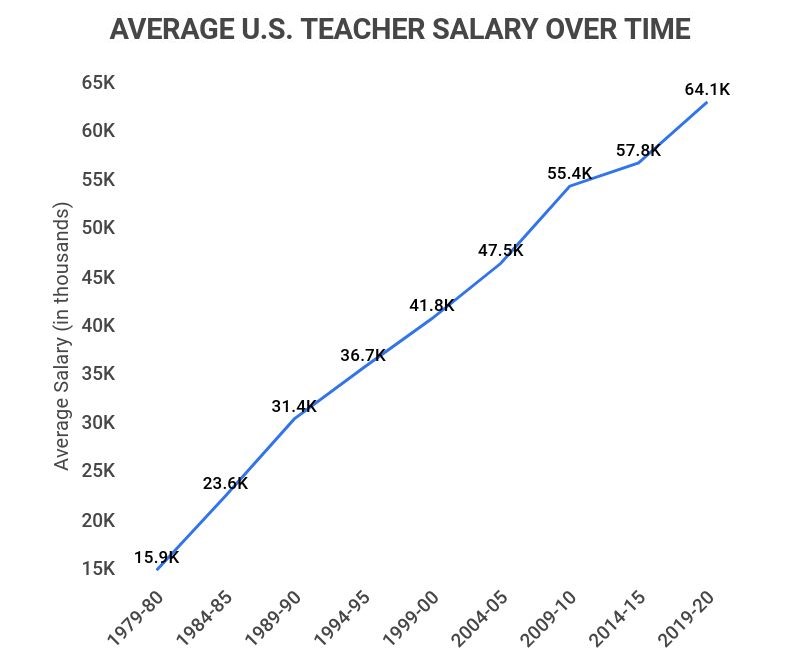
The average salary for a public school teacher in the U.S. is $65,090.
For further insight, we have categorized the data into the following sections:
Impact | Trends | Demographics | Life

General U.S. Teacher Statistics (2026)
Teachers are essential in shaping the future of the nation by educating millions of children. Here are some striking facts about the teaching profession:
-
There are now approximately 3.8 million teachers in both public and private schools across the U.S.
-
There are around 130,930 elementary and secondary schools operating in the country.
-
The U.S. has about 13,600 public school districts.
-
As of the 2022-2023 school year, there were approximately 50 million students enrolled in pre-K through 12th grade.
-
The average salary for an elementary school teacher is around $65,420, while a high school teacher averages $67,340.
-
Teachers in New York earn the highest average salaries in the nation, while those in Mississippi earn the lowest.
Teacher Statistics by Impact on Students
Teachers leave a profound impact on their students, influencing their lives in significant ways. Research indicates:
-
The average teacher will influence over 3,000 students throughout their career.
-
83% of students report that a teacher helped boost their confidence and self-esteem.
-
87% of individuals wish they had expressed their appreciation to their teachers.
-
88% of people feel their teachers played a vital role in their lives.
-
79% of students say they were encouraged by a teacher to pursue their dreams.
-
54% of students have had a teacher who supported them during tough times.
-
75% of students view teachers as mentors and role models.
Teacher Trends and Projections (2026)
The teaching profession continues to evolve, especially in the wake of various educational reforms and societal shifts. Here are the latest trends and projections:
-
By 2026, the demand for teachers in the U.S. is projected to exceed supply by over 100,000.
This estimate, not accounting for recent shifts due to the pandemic and increased teacher burnout, may reflect an even larger deficit than previously anticipated.
-
The average student-to-teacher ratio has improved slightly to 15:1.
Here’s a brief history of the student-to-teacher ratio from 2000 to 2026:
U.S. Student/Teacher Ratio Over Time
Year Student/Teacher Ratio 2000 15:9 2001 15:7 2002 15:7 2003 15:7 2004 15:5 2005 15:4 2006 15:3 2007 15:2 2008 15:0 2009 15:3 2010 15:2 2011 15:2 2012 15:1 2013 15:0 2014 14:8 2015 14:7 2016 14:6 2017 14:5 2018 14:4 2019 14:3 2020 15:1 2021 15:1 2022 15:1 2023 15:1 2024 15:1 2025 15:1 2026 15:1 -
The job outlook for kindergarten and elementary school teachers from 2020 to 2030 is projected to grow by 7%.
In the same timeframe, high school teachers are expected to see an 8% growth rate, aligning with the average growth for all U.S. occupations. This growth will largely stem from teacher retirements and transitions to other careers rather than new school openings.
Teacher Statistics by Demographics (2026)
Diversity is an essential aspect of the teaching profession in the U.S. Here are some insightful statistics:
-
The average age of teachers in the U.S. is now 42.4 years.
The largest group (56.9%) of teachers are aged between 30 and 49. Here’s the age breakdown:
Teachers by Age Range
Age Range Percentage of Teachers Under 30 15% 30-49 56.9% 50-54 11.6% 55+ 16.5% -
There are currently 3.8 million public school teachers in the U.S.
Additionally, there are about 500,000 private school teachers.
-
74.3% of U.S. teachers are female.
This means that just 25.7% are male. The disparity is more pronounced in elementary schools, where 89% are female and 11% are male; however, the gap narrows in secondary schools, where 64% are female and 36% are male.
-
79.3% of U.S. teachers are identified as white.
Here’s a demographic breakdown of U.S. teachers:
Share of Teachers by Race/Ethnicity
Race/Ethnicity Percentage of U.S. Teachers White (Non-Hispanic) 79.3% Hispanic (Regardless of Race) 9.3% Black or African American (Non-Hispanic) 6.7% Asian (Non-Hispanic) 2.1% Two or More Races (Non-Hispanic) 1.8% Native American/Alaska Native (Non-Hispanic) 0.5% Native Hawaiian/Pacific Islander (Non-Hispanic) 0.2%
Teacher Statistics by Life as a Teacher (2026)
Teaching can be a challenging profession, and many teachers face significant hurdles. Here are some facts about the realities of life as a teacher:
-
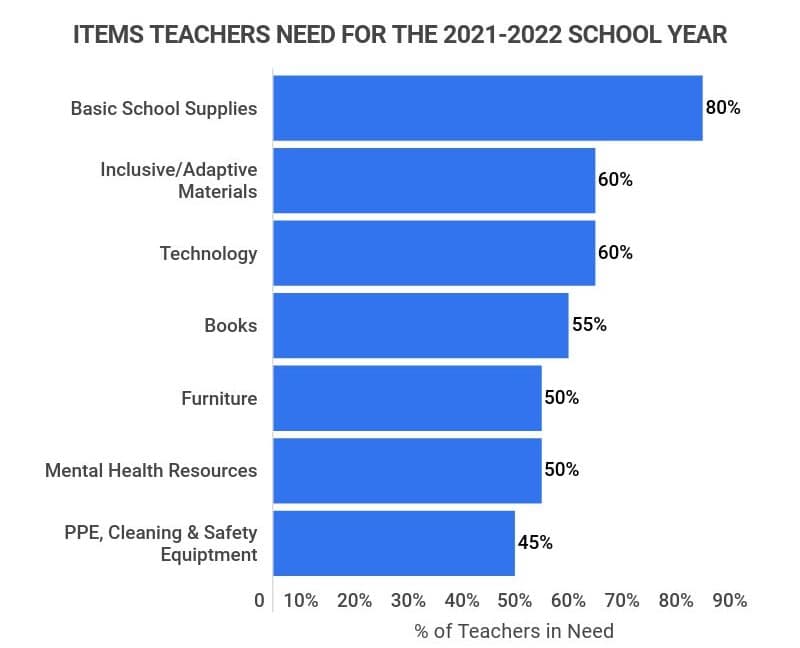
Teachers spend an average of $750 annually on classroom supplies.
-
On average, teachers work 53.3 hours a week, encompassing both teaching and related tasks.
-
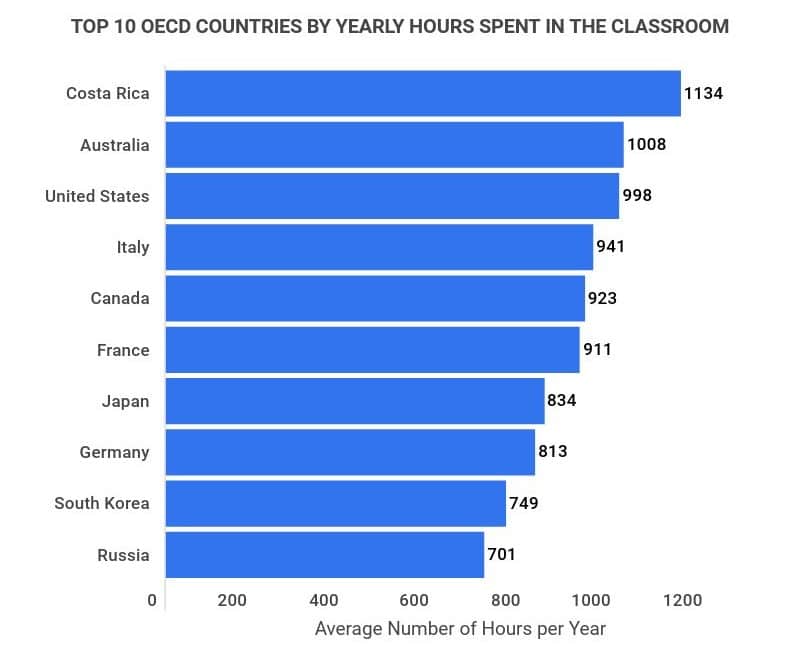
Teachers spend about 998 hours annually in the classroom teaching.
-
18% of teachers hold second jobs during the academic year, compared to 4.5% of all U.S. workers.
-
89% of people recognize teaching as a challenging profession.
Teacher Statistics FAQ
-
What percentage of teachers are happy?
About 60% of teachers report being satisfied with their careers. According to a recent CareerExplorer survey, teachers rated their job satisfaction at three out of five stars. While this may seem average, it places teachers in the bottom 36% of all careers for happiness. Although many teachers find their work fulfilling, their dissatisfaction often stems from salary concerns, with only 28% rating their compensation as four or five stars.
The average salary for a U.S. public school teacher is $65,090, while the average salary for all occupations requiring a bachelor’s degree is $67,860. Many teachers, who typically hold at least a bachelor’s degree, often find themselves earning less than their similarly educated peers.
-
How much impact do teachers have on students?
Teachers significantly impact their students. Over their careers, a single teacher is estimated to influence an average of 3,000 students, whether through direct classroom interactions or other engagements.
Teachers serve not only as educators but also as supportive adults for many children. More than half of students report that a teacher helped them through challenging times, and 75% see their teachers as mentors and role models.
Additionally, 79% of students state that a teacher encouraged them to pursue their dreams, while 88% acknowledge the positive impact teachers have had on their lives.
-
Why do teachers leave the profession?
Teachers quit for various reasons, including inadequate preparation, lack of support, low pay, and the pursuit of alternative careers. Many new teachers exit within their first few years, often due to insufficient preparation. Teachers who feel supported through mentoring or training are less likely to leave.
Furthermore, even experienced teachers may depart due to a lack of administrative support or the inability to collaborate with colleagues. Dissatisfaction with compensation remains a widely discussed reason for teacher turnover, as many earn significantly less than their similarly educated peers, particularly mid-career.
Additionally, about 25% of departing teachers cite the pursuit of better career opportunities, while around 30% mention personal life changes as a factor in their decision. During recent years, increased burnout and health concerns have also driven many educators to leave the profession.
-
What percentage of teachers quit within the first five years?
44% of teachers leave the profession within the first five years. This attrition rate is significantly higher than in most other occupations in the U.S., including those known for high burnout, such as law enforcement.
While this statistic is concerning, it has been relatively consistent for nearly two decades, with experts estimating that around half of teachers exit within their first five years. Recent studies have confirmed these projections.
-
Which country pays teachers the most?
Teachers earn the highest salaries in Luxembourg, averaging $101,360. This figure is more than 55% above the average American salary of just over $65,000. Other countries known for high teacher salaries include:
-
Germany ($80,407)
-
Canada ($71,664)
-
Netherlands ($71,024)
-
Australia ($65,658)
-
Conclusion
Teachers have a profound impact, with each educator influencing over 3,000 students throughout their careers. With approximately 3.8 million teachers in the U.S., their contributions significantly shape the lives of countless individuals.
However, the teaching profession faces challenges, with nearly half of all teachers leaving within the first five years of their careers, often due to low pay, lack of support, or personal circumstances. By 2026, the demand for teachers is anticipated to exceed supply by over 100,000.
The U.S. teaching job market is projected to grow by an average of 7% annually from 2020 to 2030. This growth aligns with national trends, but the increase in teaching positions is primarily due to retirements and career transitions rather than new job creation.
References
-
Statista. “Average Salary of Classroom Teachers in Public Schools in the U.S. From 1980 to 2021.” Accessed on April 21, 2022.
-
NCES. “Back-to-School Statistics” Accessed on April 21, 2022.
-
NCES. “Educational Institutions.” Accessed on April 21, 2022.
-
CER. “K-12 Facts.” Accessed on April 21, 2022.
-
U.S. News. “High School Teacher Salary.” Accessed on April 21, 2022.
-
Statista. “Estimated Average Salary of Public School Teachers in the United States in 2020-2021, by State.” Accessed on April 21, 2022.
-
We Are Teachers. “12 Powerful Statistics That Prove Why Teachers Matter.” Accessed on April 21, 2022.
-
Learning Policy Institute. “A Coming Crisis in Teaching? Teacher Supply, Demand, and Shortages in the U.S.” Accessed on April 21, 2022.
-
NCES. “Digest of Education Statistics.” Accessed on April 21, 2022.
-
U.S. Bureau of Labor Statistics. “Occupational Outlook Handbook: Kindergarten and Elementary School Teachers.” Accessed on April 21, 2022.
-
U.S. Bureau of Labor Statistics. “Occupational Outlook Handbook: High School Teachers.” Accessed on April 21, 2022.
-
NCES. “National Teacher and Principal Survey: Average and Median Age of Public School Teachers and Percentage Distribution of Teachers by Age Category, Sex, and State: 2017-18.” Accessed on April 21, 2022.
-
NCES. “Teacher Characteristics and Trends.” Accessed on April 21, 2022.
-
NCES. “Characteristics of Public School Teachers.” Accessed on April 21, 2022.
-
NCES. “Data Point: Race and Ethnicity of Public School Teachers and Their Students.” Accessed on April 21, 2022.
-
AdoptAClassroom.org. “How Much Do Teachers Spend on Supplies?” Accessed on April 21, 2022.
-
NCES. “National Teacher and Principal Survey: Number and Percentage of Public School Teachers Who Are Regular Full-Time Teachers and Average Number of Hours Per Week That Regular Full-Time Teachers Spent on Selected Activities During a Typical Full Week, by Selected School Characteristics: 2015–16.” Accessed on April 21, 2022.
-
Statista. “Where Teachers Spend the Most Time in the Classroom.” Accessed on April 21, 2022.
-
Pew Research. “About One-in-Six U.S. Teachers Work Second Jobs – And Not Just in the Summer.” Accessed on April 21, 2022.
-
U.S. Bureau of Labor Statistics. “Labor Force Statistics From the Current Population Survey.” Accessed on April 21, 2022.
-
CareerExplorer. “Teachers Are Below Average When it Comes to Happiness.” Accessed on April 21, 2022.
-
NerdWallet. “Average Salaries in the U.S.: How Do You Compare?” Accessed on April 21, 2022.
-
Learning Policy Institute. “Why Do Teachers Leave?” Accessed on April 21, 2022.
-
Education Week. “5 Things to Know About Today’s Teaching Force.” Accessed on April 21, 2022.
- Job Seeker Statistics
- Career Change statistics
- Internship Statistics
- Job Search Statistics
- Average Number Of Jobs Applied
- Average Salary Increase When Changing Jobs
- Part Time Job Statistics
- Age Discrimination Statistics
- Networking Statistics
- Interview Statistics
- Average Number of Jobs In A Lifetime
- Resume Statistics
- Side Hustle Statistics
- Teacher Statistics
Author
Abby is a writer who is passionate about the power of story. Whether it’s communicating complicated topics in a clear way or helping readers connect with another person or place from the comfort of their couch. Abby attended Oral Roberts University in Tulsa, Oklahoma, where she earned a degree in writing with concentrations in journalism and business.